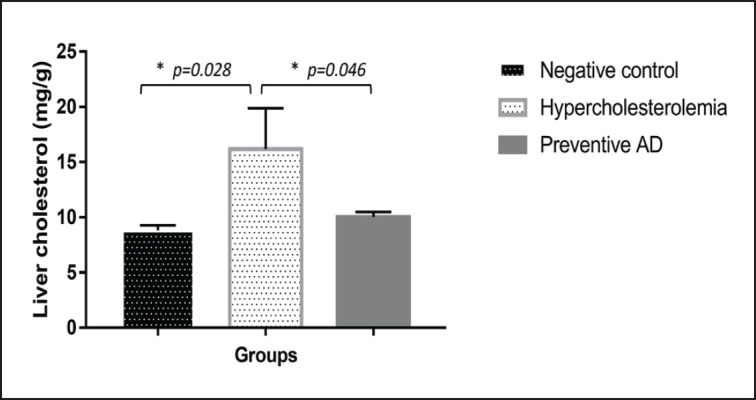
Figure 5. Liver organ cholesterol levels in each experimental group. The liver cholesterol content in the hypercholesterolemia group was higher than that in the other groups. Rats treated with AD had the same liver cholesterol levels as those in the negative control group (p > 0.05). AD = Ampiang-Dadih.

