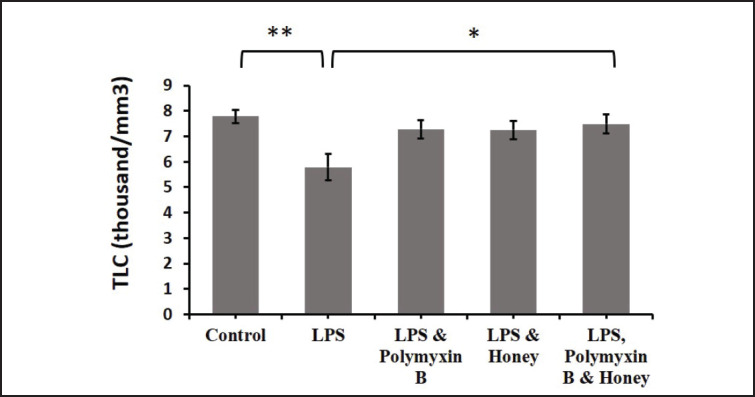
Figure 3. Effect of LPS, polymyxin B, and honey on TLC in mice. The mean values of TLC of mice of different treatment groups are presented in the graph. Untreated control mice, LPS-treated mice, LPS plus polymyxin B treated mice, LPS plus honey-treated mice, and LPS plus polymyxin B plus honey-treated mice. Data are shown as mean ± SD. The differences between the two groups of animals were compared by using one-way repeated measure ANOVA followed by Tukey’s multiple comparisons tests. Here, **=Statistically significant at 1% level (p < 0.01), *= Statistically significant at 5% level (p < 0.05).

