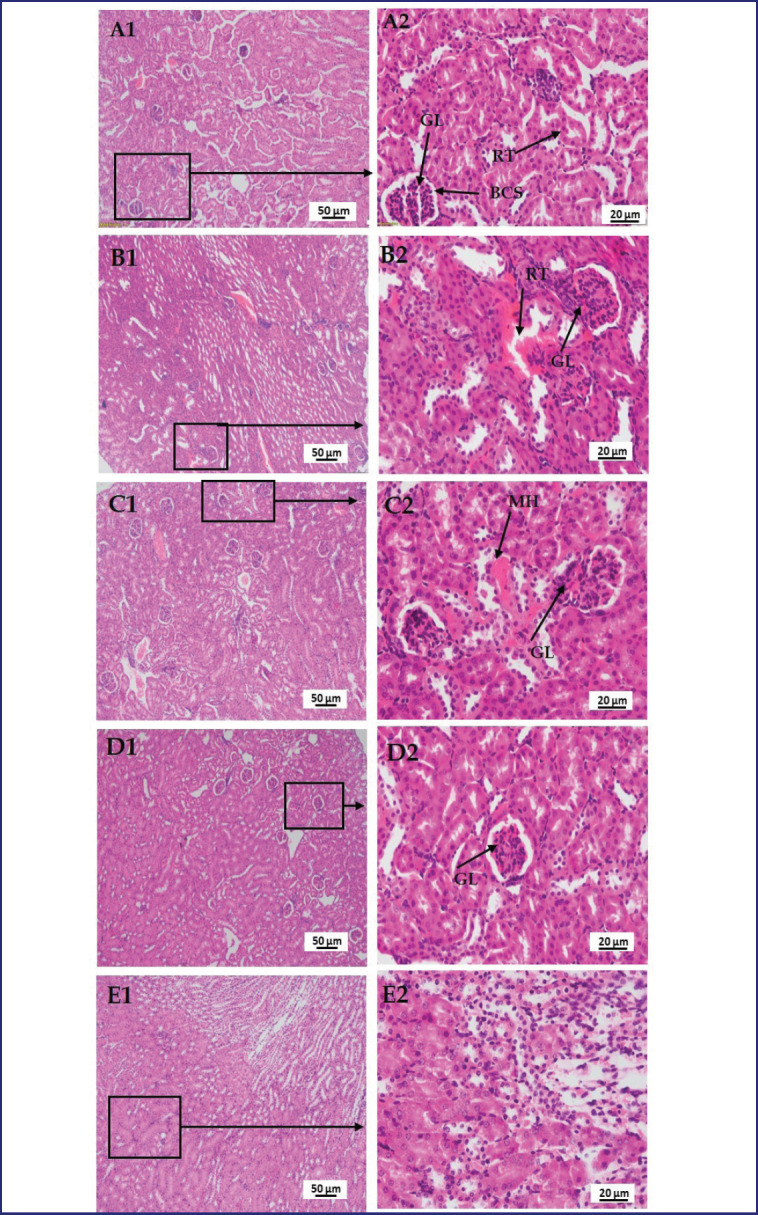
Figure 9. Photomicrograph of histo-structures of kidney of different treatment groups.Group A-Control, Group B-LPS treated group, Group C-LPS and Polymyxin B treated group, Group D-LPS and Honey treated group, Group E-LPS, Polymyxin B and honey treated group. Control group A showed normal tissue structures with regularly organized glomerulus (GL), bowman’s capsular space (BS), and convoluted renal tubules (RT). But in the case of LPS-treated group B, numerous cellular infiltrations in the glomerulus (GL) and hemorrhage in renal tubules (RT). In the case of group C, mild congestion and relatively less glomerular infiltration. In the case of group D, no hemorrhage and no significant glomerular infiltration. However, in group E, there were no detectable changes rather than a smaller number of cellular infiltrations.

