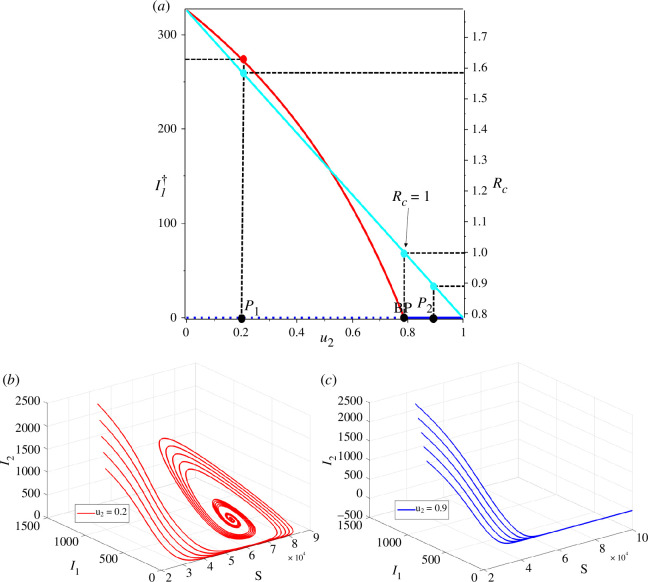
Figure 11.
(a) Bifurcation diagram of system equations (2.1)–(2.5) represented by and with respect to . The solid lines represent the stable branch of the equilibrium point and the dotted line represents the unstable branch of the equilibrium point. The red and cyan curves represent the endemic equilibrium and the , respectively. Panels (b) and (c) show trajectories solution of and at two different sample points and . All solutions were obtained numerically using various initial conditions.

