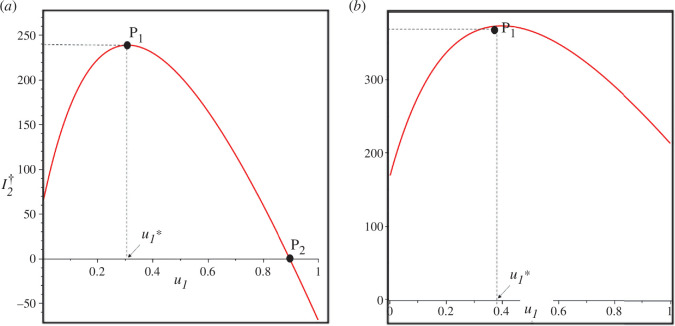
Figure 2.
Curve of as a function of using Lesotho and Indonesia data in panels (a) and (b), respectively. is the turning point of , while is when . When , then increases as increases. The critical value for Lesotho and Indonesia is 0.308 and 0.398, respectively. TB-endemic equilibrium only exists when .

