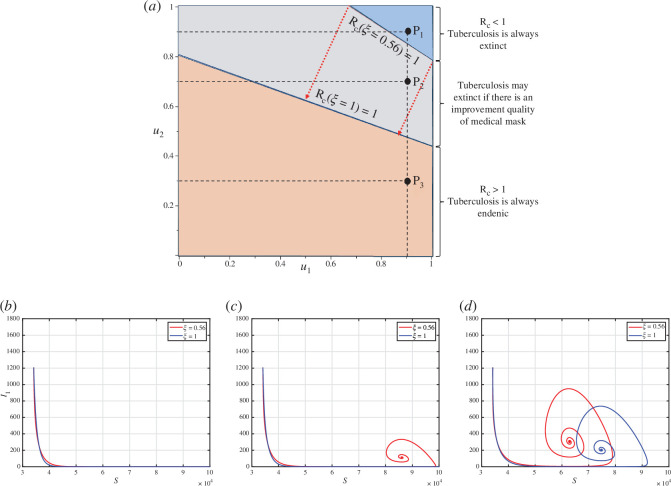
Figure 4.
A two-parameter sensitivity analysis of respect to and under the impact of given in panel (a). The orange region represents an domain that is always larger than 1, while blue is always smaller than 1, independent of the value of . The grey region represents the area of that may change from greater than 1 to smaller than 1 as increases. Panels (b) to (d), show the dynamics of and for sample points , and , respectively.

