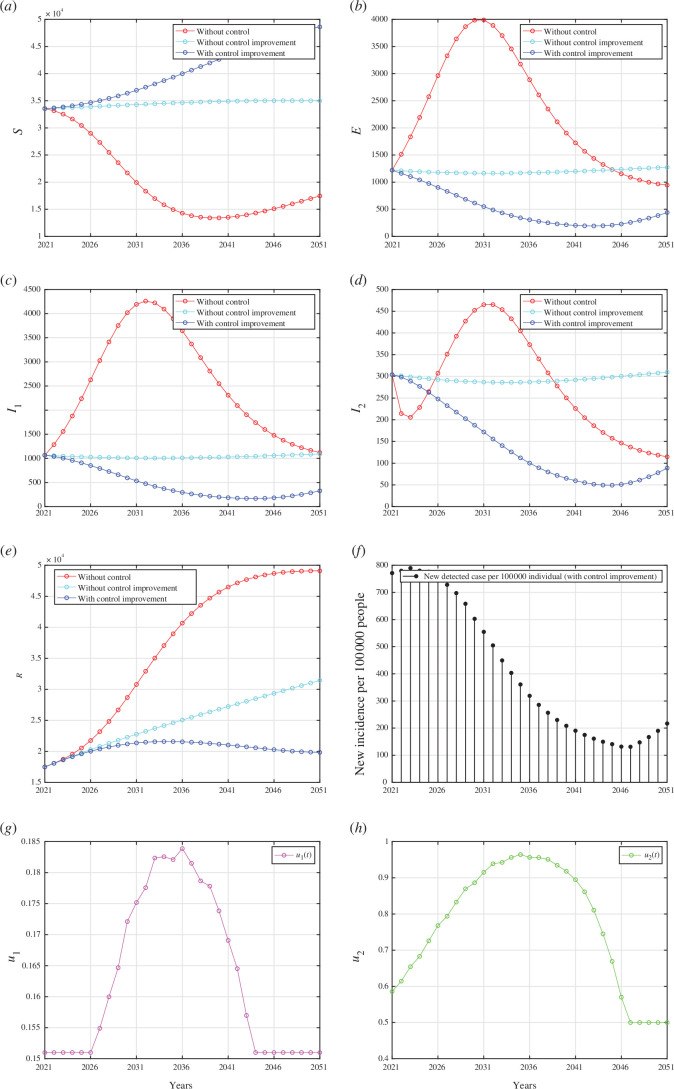
Figure 7.
Forecasting and optimal control results for Indonesian data from 2021 to 2051 when case detection and medical mask use are implemented together. Panels (a) to (e) represent the dynamic of and , respectively. Panel (f) represents the case incidence per 100 000 people while panels (g) and (h) show the dynamic of control and , respectively.

