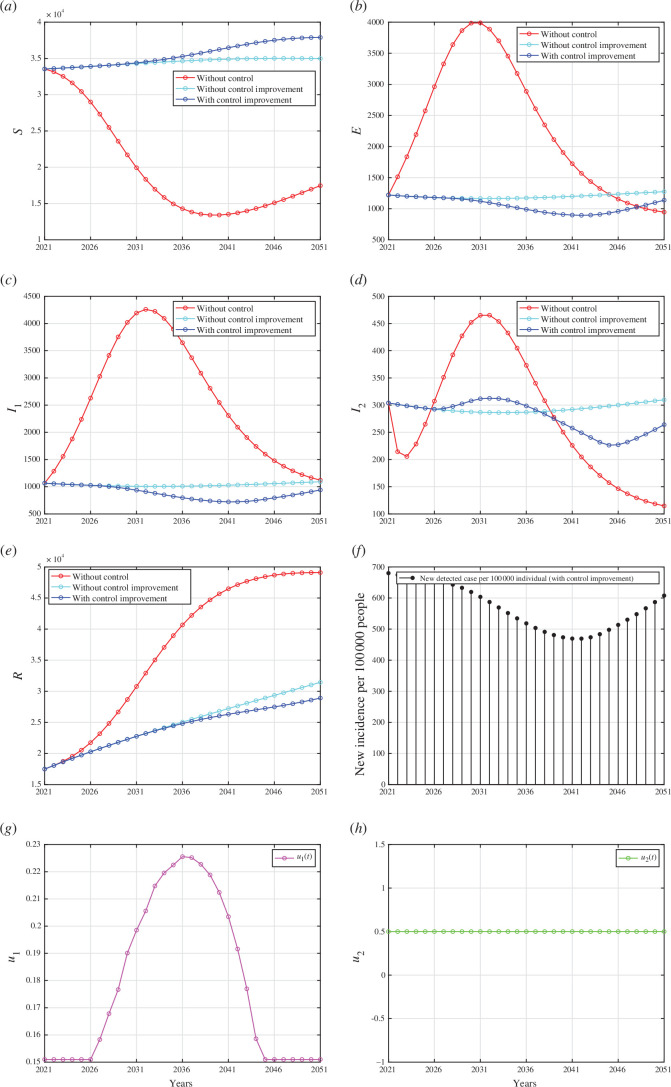
Figure 8.
Forecasting and optimal control results for Indonesian data from 2021 to 2051 when case detection intervention improved, but medical mask left as a constant at . Panels (a) to (e) represent the dynamic of and , respectively. Panel (f) represent the case incidence per 100 000 people while panels (g) and (h) show the dynamic of control and , respectively.

