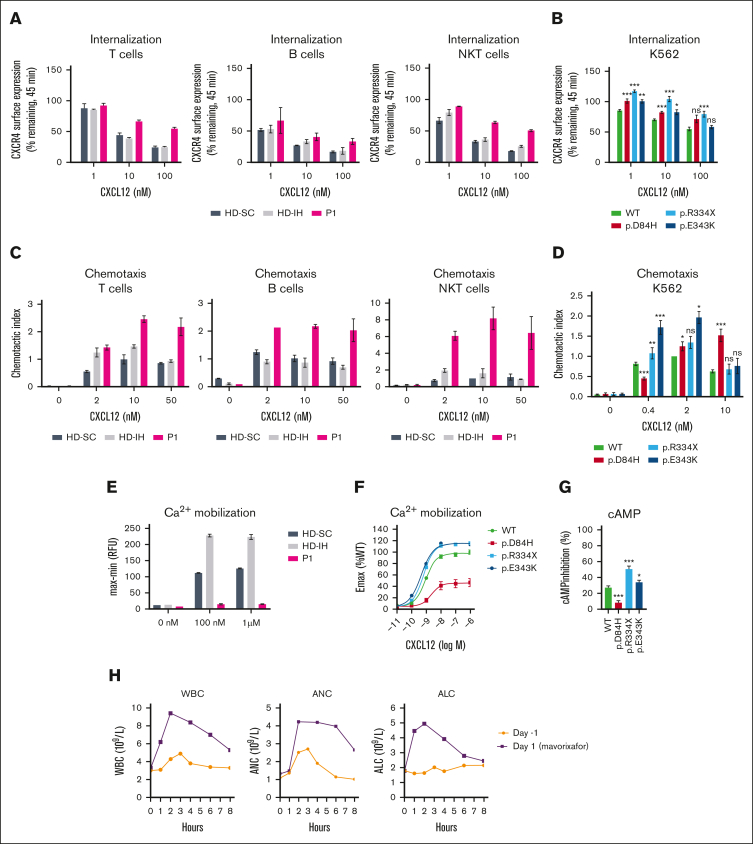
Figure 1.
Impact of CXCR4D84H on receptor function and effects of mavorixafor treatment in P1. (A) PBMCs isolated from HDs (HD-SC and HD-IH) and P1 were stimulated with CXCL12 (vehicle, 1 nM, 10 nM, and 100 nM) for 45 minutes. CXCR4 receptor internalization was assessed by surface expression of CXCR4 by flow cytometry. Values are expressed as percent of remaining CXCR4 expression compared with vehicle-treated cells. PBMCs were subtyped using fluorescent mAbs specific for CD3 (T cells), CD19 (B cell), and CD3 and CD56 (NKT cells). Statistical analysis was not performed owing to low sample numbers. Mean ± standard deviation (SD) of 2 to 4 from 2 biological replicates. (B) K562 cells were transiently transfected with indicated CXCR4 constructs and stimulated with CXCL12 (vehicle, 1 nM, 10 nM, and 100 nM) for 45 minutes. CXCR4 receptor internalization was assessed by surface expression of CXCR4 via flow cytometry. Statistical significance determined by Mann-Whitney tests comparing variants with the WT at each respective concentration of ligand. Values are expressed as percent of remaining CXCR4 compared with vehicle-treated cells. Values represent mean ± standard error of mean (SEM) of 3 to 17. ∗P < .05; ∗∗P < .01; ∗∗∗P < .001. (C) Transwell chemotaxis assay: PBMCs isolated from HDs (HD-SC and HD-IH) and P1 migrated toward 2, 10, and 50 nM CXCL12 or medium only for 2.5 hours. The total number of migrated cells was normalized to the HD-SC with 10 nM CXCL12 in each cell type. PBMCs were subtyped using fluorescent mAbs specific for CD3 (T cells), CD19 (B cell), and CD3 and CD56 (NKT cells). Statistical analysis in PBMCs was not performed owing to low sample numbers. Mean ± SD of 2. (D) Transwell chemotaxis assay: K562 cells transiently transfected with indicated CXCR4 constructs migrated toward 0.4, 2, and 10 nM CXCL12 or medium only for 4 hours. The total number of migrated cells was normalized to WT with 2 nM CXCL12 in each assay. Statistical significance was determined by Mann-Whitney tests (0.4 nM and 10 nM) and 1-sample Wilcoxon signed-rank test (2 nM) comparing variants with the WT at each respective concentration of ligand. Mean ± SEM of 5 to 20. ∗P < .05; ∗∗P < .01; ∗∗∗P < .001. (E) PBMCs isolated from HDs (HD-SC and HD-IH) and P1 were stimulated with vehicle, 100 nM or 1 µM CXCL12 to measure Ca2+ mobilization. Statistical analysis was not performed owing to low sample numbers; n = 2 technical replicates; the experiment is representative of 2 independent experiments. (F) K562 cells with stable CXCR4 expression were stimulated with serial dilutions of CXCL12 to measure Ca2+ mobilization. Relative fluorescence units measured in WT-expressing cell line at 1 µM CXCL12 represented 100%. Mean ± SEM of 11 to 12. (G) K562 cells with stable CXCR4 expression were stimulated with forskolin ± 100 nM CXCL12 for 30 minutes. cAMP production was measured by enzyme-linked immunosorbent assay. Percent of inhibition of cAMP production by CXCL12 was calculated respective to forskolin-only treated cells. Statistical significance was determined by Mann-Whitney tests comparing variants with the WT. Values represent mean ± SEM of 9 to 12. ∗P < .05; ∗∗P < .01; ∗∗∗P < .001. (H) Time course of WBC counts, ANC, and ALC for P1 before receiving oral mavorixafor (day –1) and on the first day of mavorixafor treatment (day 1). ALC, absolute lymphocyte count; AMC, absolute monocyte count; ANC, absolute neutrophil count; CD, cluster of differentiation; HD-IH, healthy donor in-house; HD-SC, healthy donor shipping control; mAb, monoclonal antibody; NK, natural killer; NKT, natural killer T; ns, not significant; WBC, white blood cell; WT, wild type.

