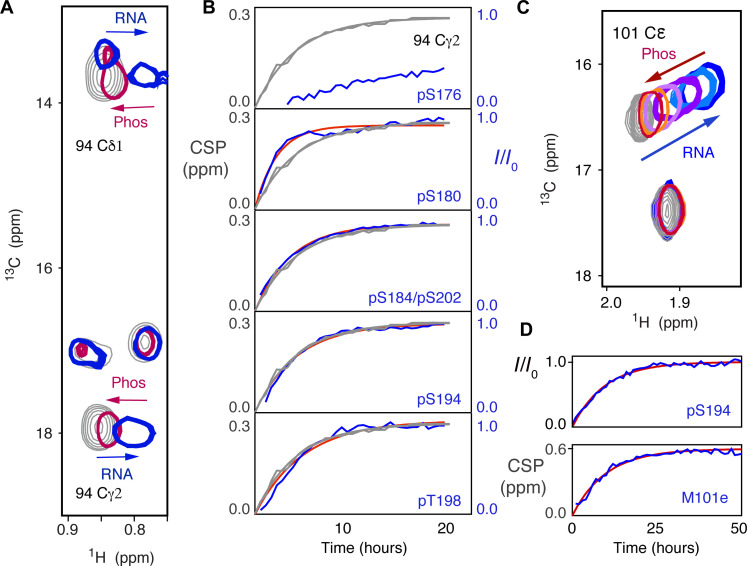
Fig. 5. Real-time observation of RNA binding inhibition by SR phosphorylation.
(A) CSPs in methyl 13C-1H HMQC of pN234(I), specifically 94Cγ2, showing the impact of 14-mer RNA binding (gray, 0 μM, blue 200 μM), and subsequent shift of the same peaks back toward the unbound form during incubation with GSK-3 (red). (B) Comparison of time course of intensity increase in the 15N-1H HSQC phosphorylation peaks from pSR (blue, experimental; red, single exponential fit) and the CSP of 94Cγ2 (gray, experimental and fitted). Associated time constants of (0.50 ± 0.07) hours (pS180), (0.30 ± 0.04) hours (pS184/pS202), (0.26 ± 0.07) hours (pS194), and (0.24 ± 0.05) hours (pT198) compared with (0.24 ± 0.03) hours and (0.26 ± 0.03) hours for 94Cγ2 and 94Cδ1, respectively. pS176 and pS186 (not shown) were too slow to be accurately fitted. (C) CSPs in methyl 13C-1H HMQC of pN234(I) (M101Cε) showing the impact of 30-mer polyA RNA binding (gray, 0 μM, blue 120 μM), and subsequent shift of the distribution of differently phosphorylated states toward the unbound, fully phosphorylated form during incubation with GSK-3 (light blue to red). (D) Comparison of (top) the time course of increase in intensity in the 15N-1H HSQC pS194 peak (blue, experimental; red, fitted to a single exponential) and (bottom) the shift of methyl 13C-1H CSP of 101Cε back from RNA-bound to unbound form during incubation with GSK-3 as shown in (C) (blue, experimental; red, single exponential fit). Associated time constants: (0.10 ± 0.04) hours pS194 and (0.099 ± 0.030) hours for 101Cε.

