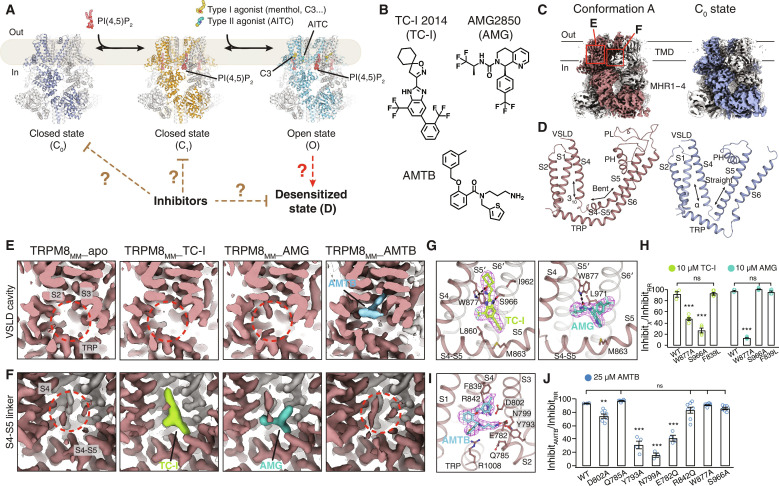
Fig. 1. Cryo-EM structure determination of TRPM8MM in complex with antagonists.
(A) Cartoon diagram of the PIP2 and cooling agonist-dependent gating pathway of TRPM8 channels. Published TRPM8MM structures in the C0, C1, and O states (PDB 8E4P, 8E4N, and 8E4L, respectively) are used for illustration. (B) Chemical structures of TC-I 2014, AMG2850, and AMTB. (C) 3D reconstructions of the conformation A (left; brown) and the C0 state (right; silver-gray). Neighboring protomers are colored in gray. (D) TMD comparison between the conformation A (left; brown) and the C0 state (right; silver-gray). S2-S3 linkers and S3 were omitted for clarity. (E and F) EM density at the VSLD cavity (E) and the S4-S5 linker (F) from the conformation A reconstruction in (C). Densities corresponding to antagonists are colored in lime for TC-I, teal for AMG, and blue for AMTB. Red dashed circles indicate the lack of antagonist densities. Thresholding 0.3 in (E) and 0.6 in (F). (G and I) Binding site and EM densities for TC-I [(G) left, lime sticks], AMG [(G) right, teal sticks], and AMTB [(I) blue sticks]. Densities in magenta mesh are contoured at thresholding 0.3 for TC-I, 0.34 for AMG, and 0.2 for AMTB. (H and J) Summary of current inhibition by 10 μM TC-I or 10 μM AMG (H) or by 25 μM AMTB (J) measured by TEVC recording on the WT and mutant TRPM8MM channels activated by 10 to 30 μM C3 at −60 mV. The antagonist inhibition level is quantified by the percentage of current inhibited by antagonists over full inhibition by 50 μM RR (see Materials and Methods). Values for individual oocytes are shown as open circles with means ± SEM (n = 3 to 8 oocytes). ns > 0.05, **P < 0.01, ***P < 0.001, using one-way ANOVA followed by Dunnett’s post hoc test.

