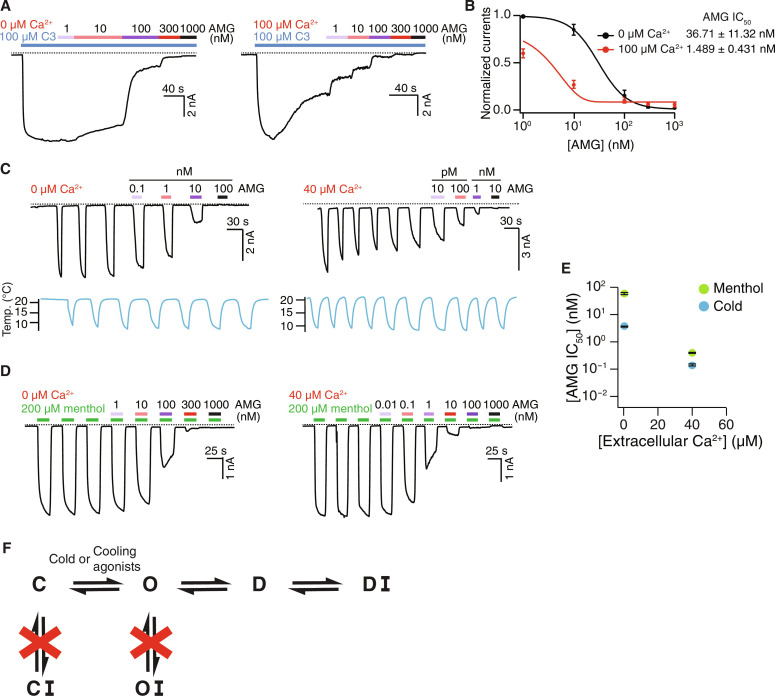
Fig. 3. TRPM8 activation by distinct stimuli converges on desensitization.
(A) Representative whole-cell recordings on HEK293T cells expressing the WT TRPM8MM channels at −60 mV. Current trace elicited by 100 μM C3 was inhibited by increasing concentrations of AMG in the presence of 0 μM (left) and 100 μM (right) extracellular Ca2+. (B) Mean normalized concentration-response relations for AMG against the WT TRPM8MM activation by 100 μM C3 in the presence of 0 μM (black trace; n = 5) or 100 μM (red trace; n = 4) extracellular Ca2+. Data are means ± SEM. The continuous curves were fit to the Hill equation with IC50 values indicated in the figure. (C and D) Representative whole-cell recordings on HEK293T cells expressing the WT TRPM8MM channels at −60 mV. Current trace elicited by cold (C) or 200 μM menthol (D) was inhibited by increasing concentrations of AMG in the presence of 0 μM (left) or 40 μM (right) extracellular Ca2+. Currents were first stabilized after three to six repeated cold or menthol activations, then increasing concentrations of AMG were coapplied with subsequent cold or menthol pulses, as indicated. (E) Summary of IC50 values for WT TRPM8MM activation by cold (blue circles) and menthol (green circles) in the presence of 0 and 40 μM extracellular Ca2+ (n = 3 to 4). Data are means ± SEM. The continuous curves fit to the Hill equation with IC50 values are in fig. S9. (F) Simplified schematic diagram showing the TRPM8 gating pathway from the C to the O state followed by D and DI with antagonist bound. Dashed lines in (A), (C), and (D) indicate the zero-current level.

