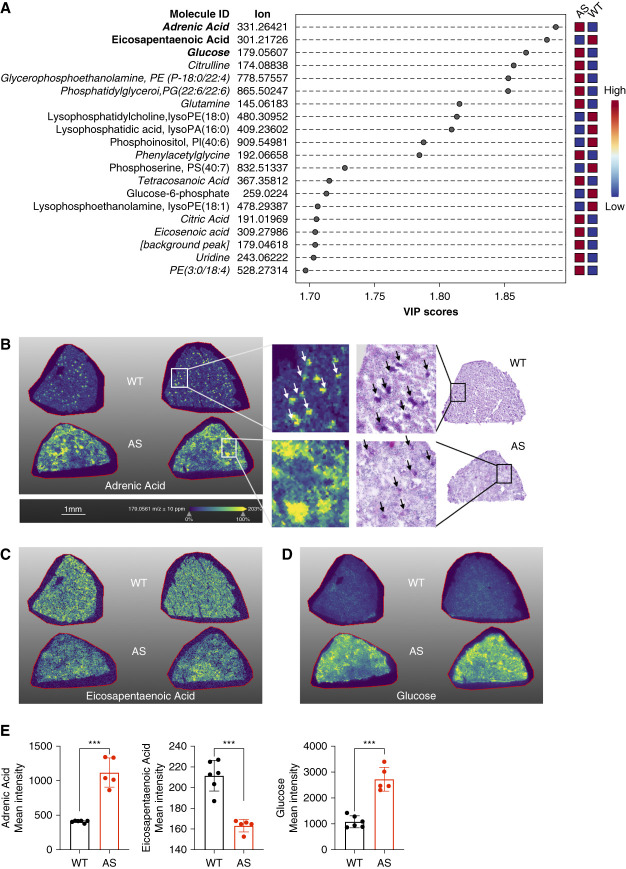
Figure 1.
MALDI-MSI analysis reveals differential accumulation and spatial distribution of metabolites in Alport mice. (A) PLS-DA identifies key discriminant metabolites between AS and WT kidneys. Italic: metabolites that are upregulated in AS. (B) Molecular ion images of AdA and PAS staining on adjacent serial sections of WT and AS mouse kidneys, with white arrows indicating AdA distribution and black arrows indicating glomeruli. (C and D) Molecular ion images of EPA and glucose in WT and AS mouse kidneys. (E) Quantification of AdA, EPA, and glucose levels in WT and AS mouse kidneys. **P < 0.001. Two-tailed Student t test. AdA, adrenic acid; AS, Alport syndrome; EPA, eicosapentaenoic acid; MALDI-MSI, matrix-assisted laser desorption/ionization mass spectrometry imaging; PLS-DA, partial least squares discriminant analysis; WT, wild type.

