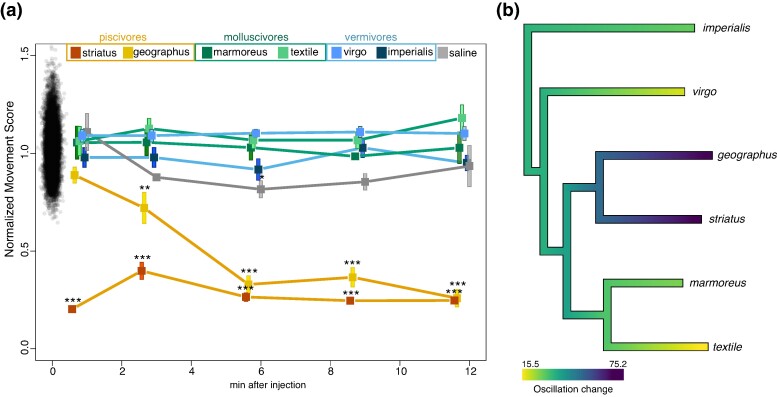
Fig. 6.
Effect of venom injection on the swimming behavior of the fish Ca. auratus. a) For each fish, the number of oscillations was normalized to the preinjection value (normalized movement score) and the mean was calculated for each time point (n = 4 to 5). Using the pool of preinjection values, we obtained an empirical null distribution of normal fish movement by dividing each preinjection recording by all other preinjection values. The baseline null distribution is plotted at time point 0. Statistical significance is indicated above each point (**P < 0.01; ***P < 0.001; permutation test). b) Ancestral state reconstruction of venom effect. Mean change in swimming oscillation 12 min after venom injection is shown at the terminal tree nodes. The internal edges of the tree show an ancestral state reconstruction of the effect of venom injection on fish behavior based on the observed changes in oscillation postinjection.

