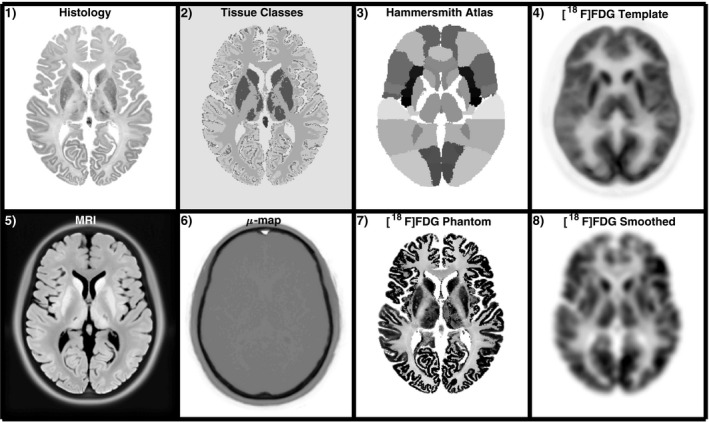
Figure 1.

First row: datasets used in the generation of the phantom. From left to right, the histology and classified tissue images of the BigBrain atlas, the Hammersmith atlas, and a normalized[
 ]FDG scan used as template. Bottom row: full output
]FDG PET‐MRI dataset. MRI image, attenuation map (μ‐map),
]FDG phantom, and a smoothed version.
