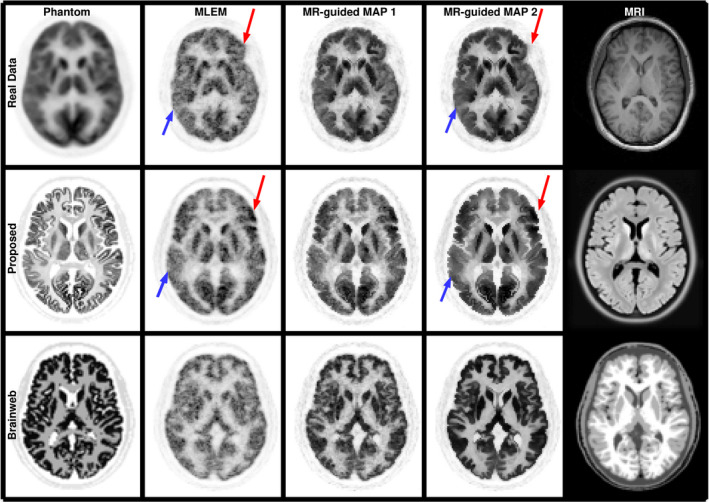
Figure 3.

Reconstructed images for the patient data that was used as a template, and for simulated datasets using the proposed phantom and a BrainWeb phantom. The data were reconstructed with the MLEM algorithm (second column) and performing MR‐guided MAP reconstructions with mild ( , third column) and strong ( , fourth column) regularization. In the first column the patient data are normalized into MNI space as it was used for the estimation of the phantom activity. In the last column, the MRI of each dataset is shown. Red arrows show the higher uptake in the left frontal lobe in the patient data and phantom. Blue arrows show lower uptake in the right temporal lobe. [Color figure can be viewed at wileyonlinelibrary.com]
