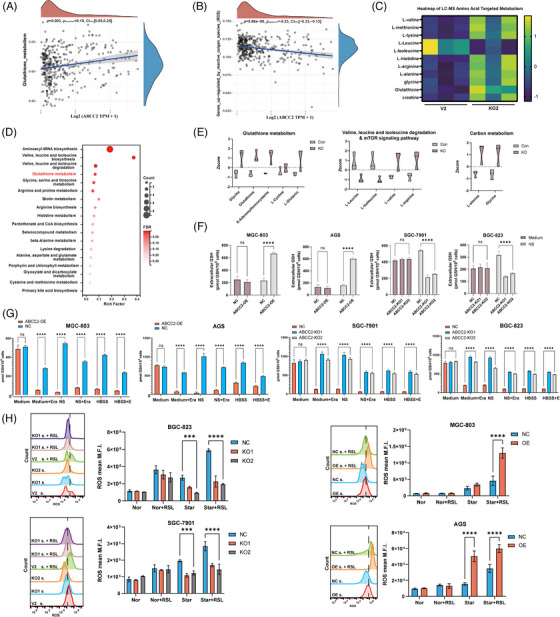
FIGURE 4.

ABCC2 causes a significant decrease in cellular amino acid levels by reprogramming cellular metabolism. (A, B) The correlations between ABCC2 and the different pathway was analyzed with Spearman. (C) Heatmap plots of metabolite alterations in ABCC2‐KO SGC7901 cells or its V2 control. (D) KEGG metabolic pathways enriched by significantly differential metabolites in the control group (V2) versus ABCC‐KO SGC‐7901 cells. One‐sided Fisher's exact test followed by BH multiple comparison test with FDR < .05 and VIP > 0. (E) Violin plots of differential metabolites in control SGC 7901 cells versus ABCC‐KO cells. (F–G) Intracellular and extracellular glutathione concentrations detected by glutathione assay kit in gastric cancer cell lines. (H) Detection of endogenous ROS in gastric cancer cell lines treated with RSL3 under different nutrient conditions.
