FIGURE 6.

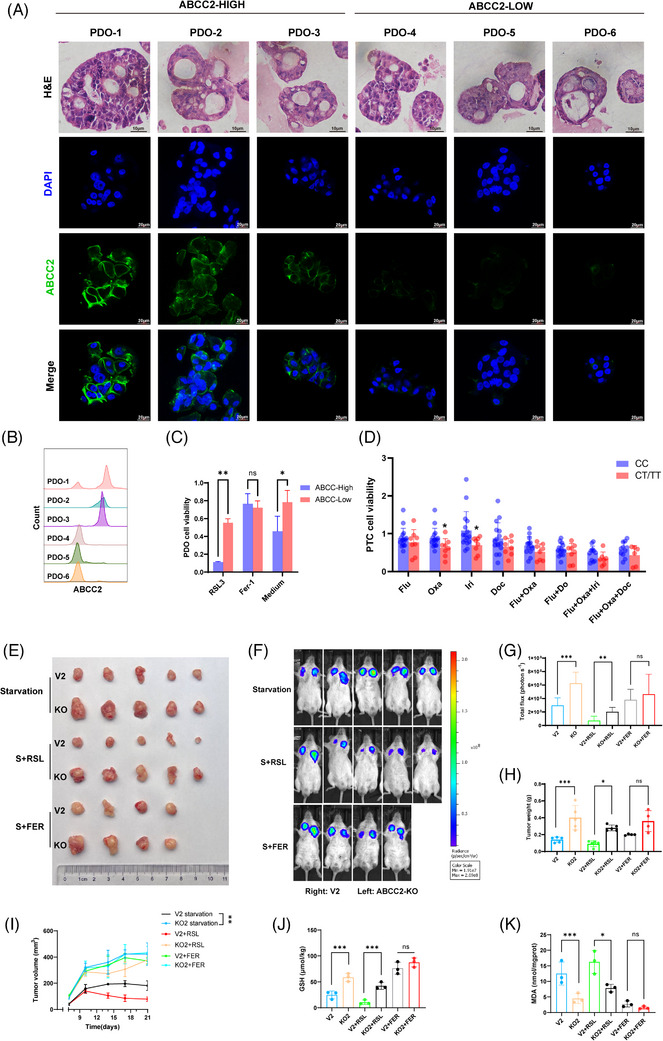
ABCC knockout gastric cancer cell line was significantly sensitive to ferroptosis inducers in vivo. (A) H&E and immunofluorescence staining of ABCC2 on serial sections of PDOs from six GC patients. Scale bars indicate 10 µm. (B) ABCC2 expression in PDOs was identified using flow cytometry. (C) Proliferation assays were performed to examine the cell viability of PDOs with ferroptosis triggers or inhibitors. (D) Proliferation assays were performed to examine the cell viability of PTCs with chemotherapy drugs. (E) The representative images and the quantification of xenograft in SGC‐7901 cells upon control (V2 plasmid) or ABCC2‐KO (cultured for 12 h in starvation medium) were implanted subcutaneously in NOD‐SCID mice (n = 5). (F) Representative images of mice and luciferase signal intensities are shown. (G) Luciferase signal intensities and tumour weights are represented as mean ± SD. (H) Tumour weights are represented as mean ± SD. (I) Tumour volumes were calculated after injection every 3 for 21 days. (J) Glutathione concentrations were detected by glutathione assay kit in xenograft of SGC‐7901 cells upon control (V2 plasmid) or ABCC2‐KO were implanted subcutaneously in NOD‐SCID mice. (K) MDA levels were evaluated in xenograft of SGC‐7901 cells upon control (V2 plasmid) or ABCC2‐KO were implanted subcutaneously in NOD‐SCID mice. *p < 0.05, **p < 0.01, ***p < 0.001 vs. the control group.
