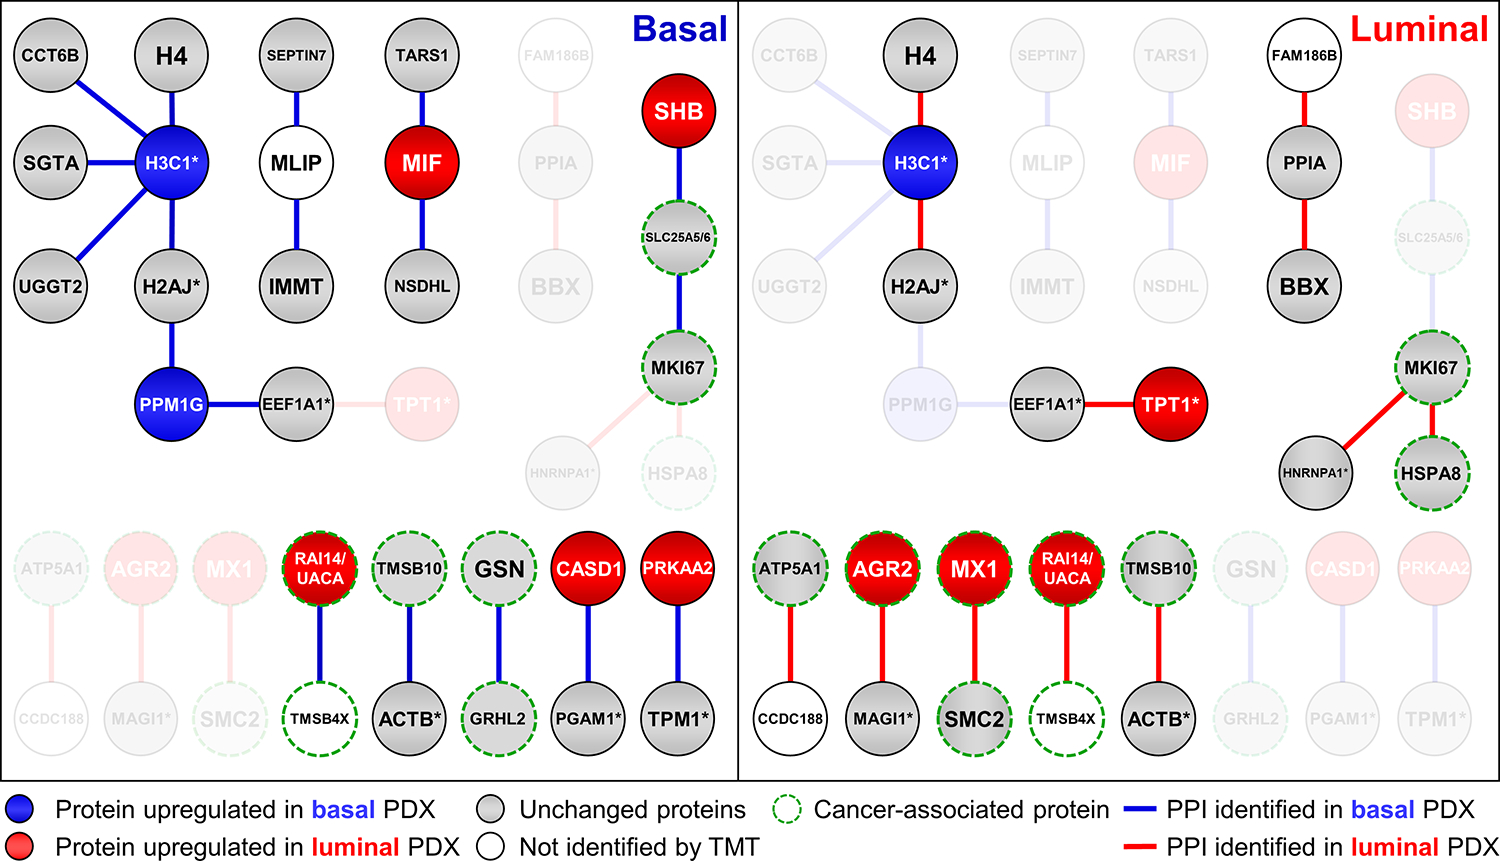
Figure 5.

Selected XL-PPIs from base and luminal PDX models. Node colors represent relative TMT quantitation in basal and luminal PDX samples. Blue: protein upregulated in basal PDX; red: protein upregulated in luminal PDX; gray: protein unchanged in basal vs. luminal PDX; no color: protein not identified in TMT-proteome. Blue edges denote XL-PPIs identified in basal PDX; red edges correspond to those identified in luminal PDX. Edges and corresponding missing nodes from each PDX sample grayed out. Note: “*” signifies a protein group containing multiple homologous proteins.
