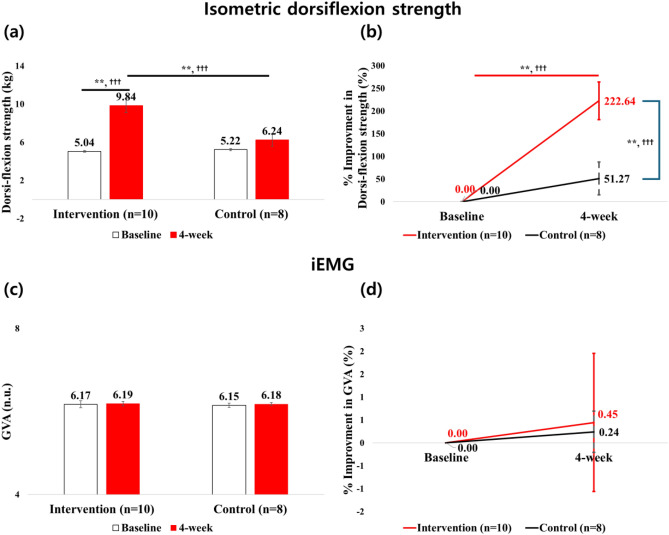
Figure 3.
Ankle dorsiflexion strength and EMG for gastrocnemius between baseline and 4 week visits for absolute (i.e., figure in left side) and %improvement (i.e., figure in right side) values: (a) is the dorsiflexion strength and baseline ankle strength was adjusted as a covariance; (b) is the improvement in dorsiflexion strength; (c) is the EMG for gastrocnemius activation during MVC (GVA); and (d) is the improvement in GVA; * = p < 0.05, ** = p < 0.01; † = low effect-size, † † = moderate effect-size, † † † = strong effect-size.

