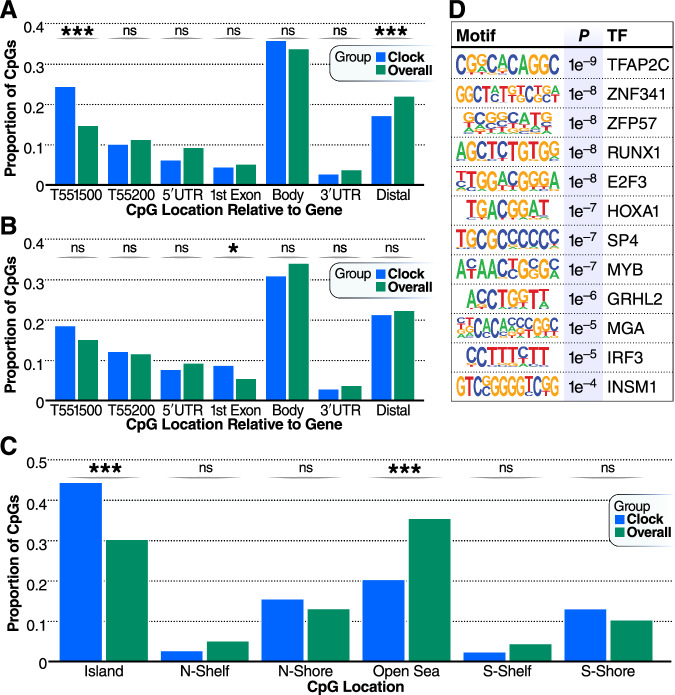
Fig. 4. Distributions of CpG positions.
A Distributions of CpG positions relative to genes in IntrinClock sites that are hyper-methylated with age relative to background. B Distributions of CpG positions relative to genes in IntrinClock sites that are hypo-methylated with age relative to background. C Genomic distribution of IntrinClock CpG positions. D HOMER analysis of the top 12 motifs enriched within 19 bp on either side (5′ or 3′) of IntrinClock sites (40 bp total). *** one-sample proportion t-test p-value < 0.001; * < 0.05.

