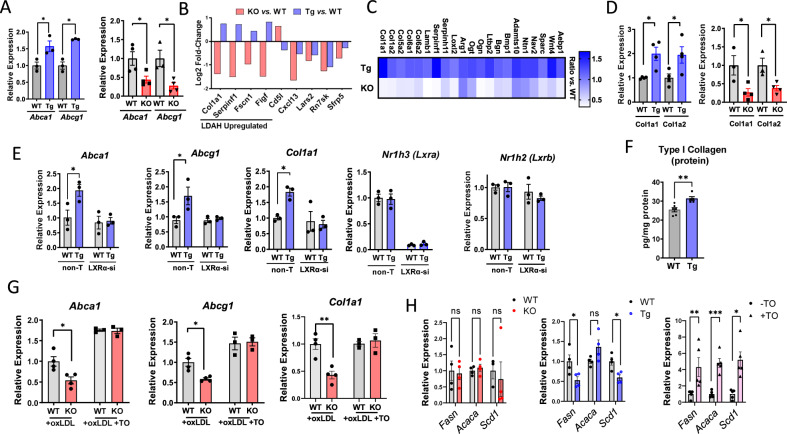
Fig. 6. LDAH induces LXR-dependent transcriptional changes.
A qPCR analysis of Abca1 and Abcg1 mRNA in PM isolated from LDAH-Tg (Tg, blue bars) and LDAH-KO (KO, red bars) mice treated with oxLDL (50 μg/ml) for 48 h vs. PM isolated from their respective WT controls (gray bars) (n = 3-4 independent samples). B Common genes identified in RNA-seq analysis of LDAH-KO (red bars) and LDAH-Tg (blue bars) PM vs. their WT controls at q-value < 0.05. C RNA-seq analyzes identified multiple ECM-related genes induced by LDAH. The upper row in the heat map (Tg) represents the ratio of LDAH-Tg PM vs. WT, and the lower row (KO) represents the ratio of LDAH-KO PM vs. their WT controls (n = 4). D qPCR analysis of Col1a1 and Col1a2 genes in LDAH-Tg (Tg, blue bars) and LDAH-KO (KO, red bars) vs. their respective WT control (gray bars) PM treated with oxLDL (50 μg/ml) for 48 h (n = 3–4). E WT (gray bars) and LDAH-Tg (Tg, blue bars) BMM were treated with siRNA against LXRα (LXR-si) or with non-target siRNA, followed by oxLDL (50 μg/ml) for 48 h. Expression of Nr1h3 (Lxra), Abca1, Abcg1, and Col1a1 was determined by qPCR (n = 3). (F) ELISA quantification of pro-collagen I alpha in WT (gray bar) and LDAH-Tg (Tg, blue bar) BMM treated with ox LDL (50 μg/ml) for 48 h (n = 5–6). G LDAH WT (gray bars) and KO (red bars) PM were treated with oxLDL (50 μg/mL) for 48 h and media was replaced by media with or without TO901317 (5 μM) for 6 h. TO rescued the downregulation of Abca1, Abcg1. and Col1a1 seen under LDAH deficiency (n = 4). H qPCR analysis of Scd1, Fasn and Acaca mRNA in LDAH-Tg (Tg, blue bars) and LDAH-KO (KO, red bars) PM treated with oxLDL (50 μg/ml) for 48 h vs. their respective WT controls (gray bars) (n = 3-4). In the right panel, WT PM were treated with oxLDL (50 μg/ml) for 48 h and media was replaced by media with ( + TO, purple bars with triangles) or without (-TO, gray bars with circular dots) TO901317 (5 μM) for 6 h (n = 5). Comparisons in (A), (D), (E) and (H) were performed by two-tailed unpaired t-test (normally distributed with equal variances), two-tailed Welch’s t-test (normally distributed with unequal variances), or two-tailed Mann-Whitney U (not normally distributed). Comparisons in (F) and (G) were performed by two-way ANOVA followed by Tukey’s test. *p < 0.05, **p < 0.01, ***p < 0.001. All bars represent mean ± SEM of independent samples. Source data are provided as a Source Data file.

