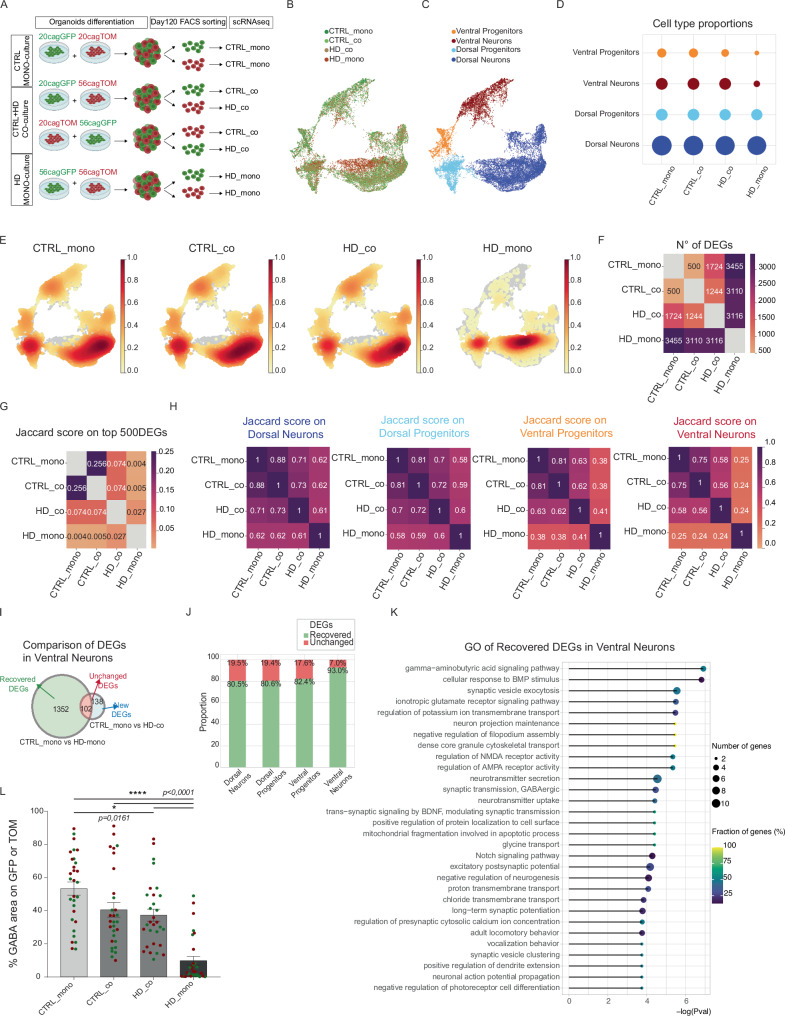
Fig. 3. Mosaic organoids reveal non-cell autonomous recovery of HD ventral identities.
A Experimental scheme for the CTRL-HD mosaic organoids. Created with BioRender.com released under a Creative Commons Attribution-NonCommercial-NoDerivs 4.0 International license B, C UMAP plots of scRNAseq analyses on mosaic organoids at DIV 120 for culture conditions (CTRL-mono, CTRL_co, HD_co, and HD_mono) and clusters of subpopulations identified with the Louvain algorithm (Ventral Progenitors, Ventral Neurons, Dorsal Progenitors, Dorsal Neurons) D Bubble plot of cell type proportions per condition E Cell density plots showing how the cells are concentrated in each condition. F Heatmap of number of DEGs (Wilcoxon test, two-sided, p < 0.05) between samples in a pairwise comparison G Heatmap of Jaccard similarity score, based on the proportion of the top 500 DEGS (defined by Wilcoxon rank-sum test) specifically identifying each condition (CTRL_mono, CTRL_co, HD_co, HD_mono) that are in common between two distinct conditions H Heatmap of Jaccard similarity score divided per subpopulations (Dorsal Neurons, Dorsal Progenitors, Ventral Progenitors, Ventral Neurons). I Venn diagram of DEGs in Ventral neurons revealing recovered genes by comparing the list of DEGs between CTRL organoids (CTRL_mono) and HD organoids (HD_mono) with a second list of DEGs between CTRL_mono and HD_co: the genes missing in this second list are the Recovered ones (in green), while genes included in both lists are the Unchanged one (in red) and genes that compare in the co-culture condition are new DEGs (in light blue) J Proportion between Recovered DEGs (in green) and Unchanged DEGs (in red) in each subpopulation K Top 30 GO terms associated to the recovered DEGs in ventral neurons, resulting from GO analysis performed with R package topGO (Fisher test, one-sided). L Automatic quantification of the area positive for GABA over GFP or TOM area (N=8 organoids from 2 independent biological replicates. error bars represent ± SEM. Anova One Way, Bonferroni post test. ****p < 0.0001, *p < 0.05). Source data are provided as a Source Data file.

