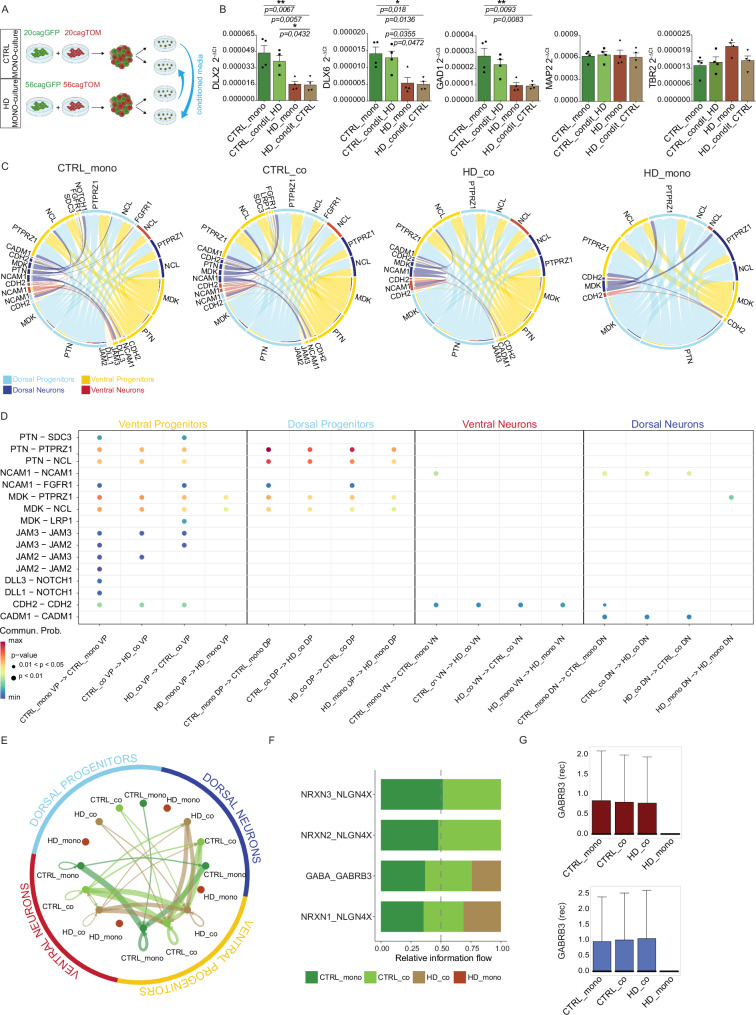
Fig. 5. Cell-cell communications show cell type specific changes in mosaic organoids.
A Experimental scheme for conditioned medium organoids with CTRL receiving media from HD and vice-versa. Created with BioRender.com released under a Creative Commons Attribution-NonCommercial-NoDerivs 4.0 International license B q-PCR for DLX2, DLX6, GAD1, MAP2, and TBR2 on CTRL and HD canonical (mono) and organoids conditioned from HD (condit HD) or from CTRL (condit CTRL) at DIV 120. (N = 4 pools of organoids from 2 independent biological replicates; error bars represent ± SEM; Anova One Way, Bonferroni post test, *p < 0,05; **p < 0,01) C CellChat circle plot communications between all subpopulations in each individual condition D CellChat bubble plot of gene expression for couples of ligands and receptors between cells grown together in the same organoid per each subpopulation. Abbreviations: VP=Ventral Progenitors; DP=Dorsal Progenitors; VN=Ventral Neurons; DN=Dorsal Neurons. Wilcoxon test, two-sided, Bonferroni adjustments for multiple comparisons E NeuronChat circle plot showing total communications between all subpopulations and conditions F NeuronChat stacked bar plot of gene expression for couples of ligands and receptors in each condition G Box plots of gene expression for GABRB3 receptor in ventral neurons and dorsal neurons for each condition. For G the box plots show the median (centre line), upper and lower quartiles (box limits), and the highest and lowest values within 1.5× the IQR of the nearest hinge (whiskers). Source data are provided as a Source Data file.

