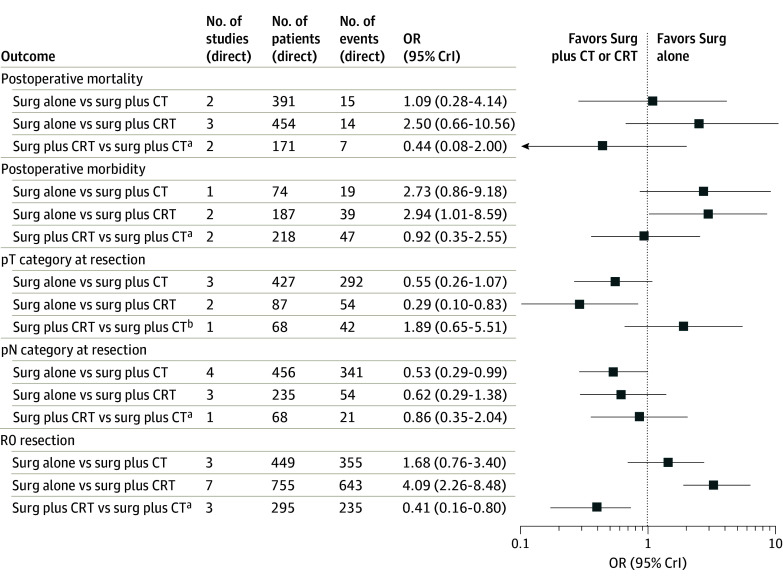
Figure 3. Summary Forest Plot of Binary Outcomes.
The plot displays the network estimates of the odds ratios (ORs) and the 95% credible interval (CrI) for each binary outcome. The numbers of studies, patients, and events are related to the direct comparison through the OR and 95% CrI, estimated from the network using direct and indirect evidence for each outcome. CRT indicates chemoradiotherapy; CT, chemotherapy; and surg, surgery.
aFavors surgery plus CT.
bFavors surgery plus CRT.

