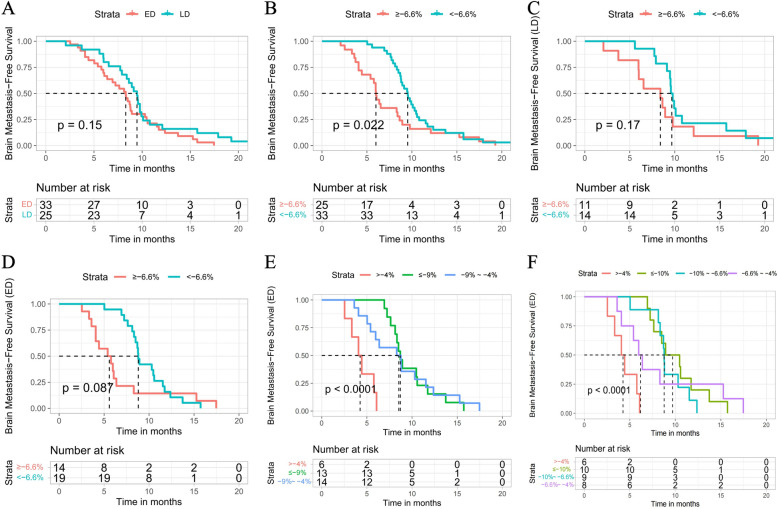
Fig. 4.
A Kaplan–Meier curves for BFS in patients with LD-SCLC and ED-SCLC. B Kaplan–Meier curves for BFS in patients with SCLC in a group with a TSR of < − 6.6% and a group with a TSR of ≥ − 6.6%. C Kaplan–Meier curves for BFS in patients with LD-SCLC in a group with a TSR of < − 6.6% and a group with a TSR of ≥ − 6.6%. D Kaplan–Meier curves for BFS in patients with ED-SCLC in a group with a TSR of < –6.6% and a group with a TSR of ≥ − 6.6%. E Kaplan–Meier curves for BFS in patients with ED-SCLC in a group with a TSR of ≤ − 9%, a group with a TSR of − 9% to − 4% and a TSR of > − 4%. F Kaplan–Meier curves for BFS in patients with ED-SCLC in a group with a TSR of < − 10%, a group with a TSR of − 10% to − 6.6%, a group with a TSR of − 6.6% to − 4%, and a group with a TSR of > − 4%. BFS, brain metastasis-free survival; ED-SCLC: extensive-disease small-cell lung cancer; LD-SCLC: limited-disease small-cell lung cancer; SCLC: small-cell lung cancer; TSR: tumor shrinkage rate

