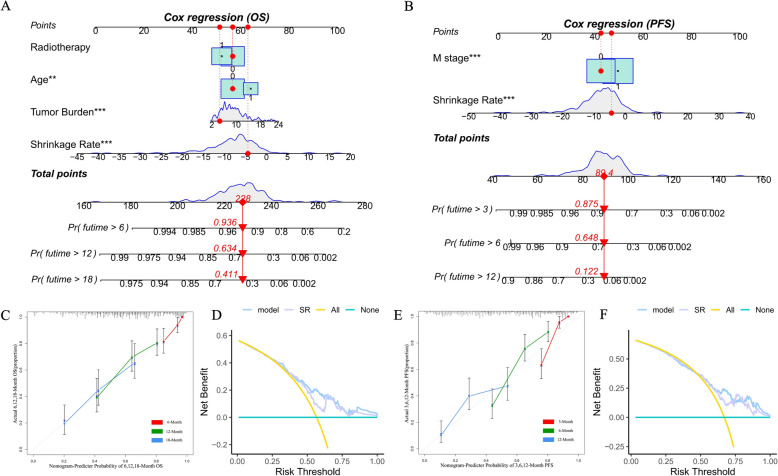
Fig. 6.
A Nomogram to determine the probability of OS for > 6 months, > 12 months, and > 18 months. B A nomogram to determine the probability of PFS for > 6 months, > 12 months, and > 18 months. B Value of each risk factor can be converted into a corresponding score according to the “points”. After adding up the individual risk scores for these risk factors, draw a line descending from the axis labeled “Total points” until it intercepts each clinical predictive score for SCLC. C Calibration curves for the OS nomogram at 6, 12, and 18 months. E Calibration curves for the PFS nomogram at 3, 6, and 12 months. Results of DCA for two models (the nomogram model and shrinkage rate) applied to OS (D) and PFS (F), respectively. The DCA curves measure the net benefit (y-axis) versus the model’s high risk threshold (x-axis) for the different models. DCA: decision curve analysis; OS: overall survival; PFS: progression-free survival; SCLC: small-cell lung cancer

