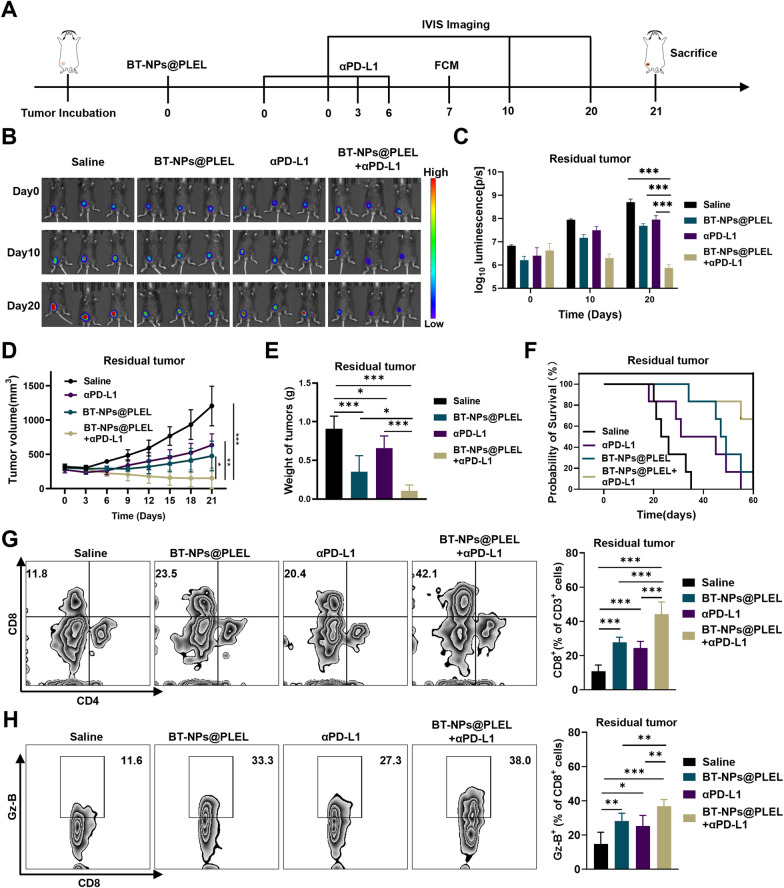
Fig. 6.
Combining BT-NPs@PLEL with anti-PD-L1 treatment for inhibition in residual tumors after iRFA. A Schematic representation of treatment of residual tumor after iRFA in C57/BL6 mice. B Bioluminescence images of mice with residual tumors after iRFA after different treatments on days 0, 10, and 20 (n = 3). C Bioluminescence signals of mice in each group on day 0, 10, and 20 (n = 3). D Tumor volume of residual tumors after iRFA in different groups(n = 6). E The weight of residual tumors on day 21 after different treatments (n = 6). F Survival analysis of experimental mice in different groups (n = 6). G Representative Flow cytometry plots and proportions of CD8+ T cells on day 7 (n = 6). H Representative flow cytometry plots and proportions of Granzyme B+ cells on day 7 (n = 6). ns, not significant *p < 0.05, **p < 0.01, ***p < 0.001

