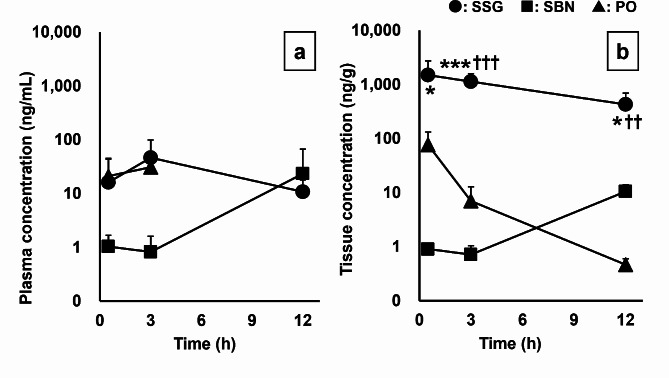
Fig. 4.
Time course of pilocarpine concentrations after topical application or oral administration of pilocarpine. (a) Pilocarpine concentrations in the plasma (SSG: n = 6 at each collection point. SBN: 0.5 h, n = 4; 3 h, n = 5; 12 h, n = 6. PO: 0.5 h, n = 6; 3 h, n = 6, excluding values below the limit of quantitation). (b) Pilocarpine concentrations in the submandibular gland tissue (SSG: n = 6 at each point. SBN: 0.5 h, n = 1; 3 h, n = 3; 12 h, n = 6. PO: 0.5 h, n = 6; 3 h, n = 6; 12 h, n = 2, excluding values below the limit of quantitation). Circles, squares, and triangles represent SSG, SBN, and PO groups, respectively. Each point indicates the mean ± standard deviation. *p < 0.05, **p < 0.01, and ***p < 0.001 for the SSG group versus the PO group. †p < 0.05 and ††p < 0.01, and †††p < 0.001 for the SSG group versus the SBN group. PO, pilocarpine administered orally; SBN, pilocarpine ointment applied to the skin on the back of the neck; SSG, pilocarpine ointment applied to the skin over the salivary glands

