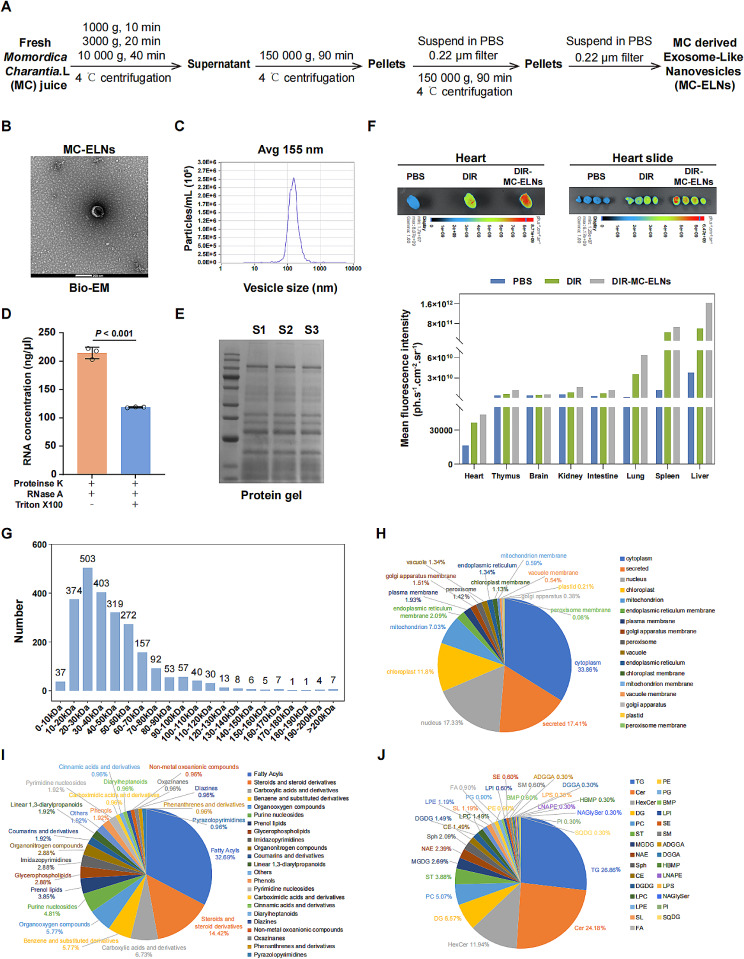
Fig. 1.
Isolation and identification of MC-ELNs. (A) Overall isolation procedures of MC-ELNs from fresh Momordica Charantia L. (MC) juice. (B) Biological electron microscope (Bio-EM) image on the morphology of MC-ELNs. Scale bar: 200 nm. (C) NTA analysis showed that the average size of MC-ELNs was around 155 nm. (D) MC-ELNs were incubated with RNase A in the presence or absence of Triton X100 to assess RNA integrity protected by the lipid bilayer membrane of extracellular vesicles. (E) MC-ELNs proteins were extracted and separated using SDS-PAGE, and then stained by Coomassie brilliant blue dye. (F) In vivo distribution of MC-ELNs. After 24 h of intravenously injection of PBS, DIR, DIR-MC-ELNs to C57BL/6J mice, ex vivo images and quantitative fluorescent intensity of various tissues, including liver, spleen, lung, intestine, kidney, brain, thymus, heart, and sectioned heart tissue were acquired with an Vilber Bio Imaging system. Representative images of heart and sectioned heart tissue (upper). Quantitative data on the in vivo fluorescent signals of various tissues (down). Compositional analysis of MC-ELNs was performed, including the molecular weights distribution of identified proteins (G) and analysis on the proteomic (H), metabolomic (I), lipidomic (J) components in the MC-ELNs. All data are presented as mean ± SD (n = 3 experiments per group for D, E, G-J; n = 1 experiment per group for F). Comparisons between two groups were performed using two-tailed unpaired student’s t-test

