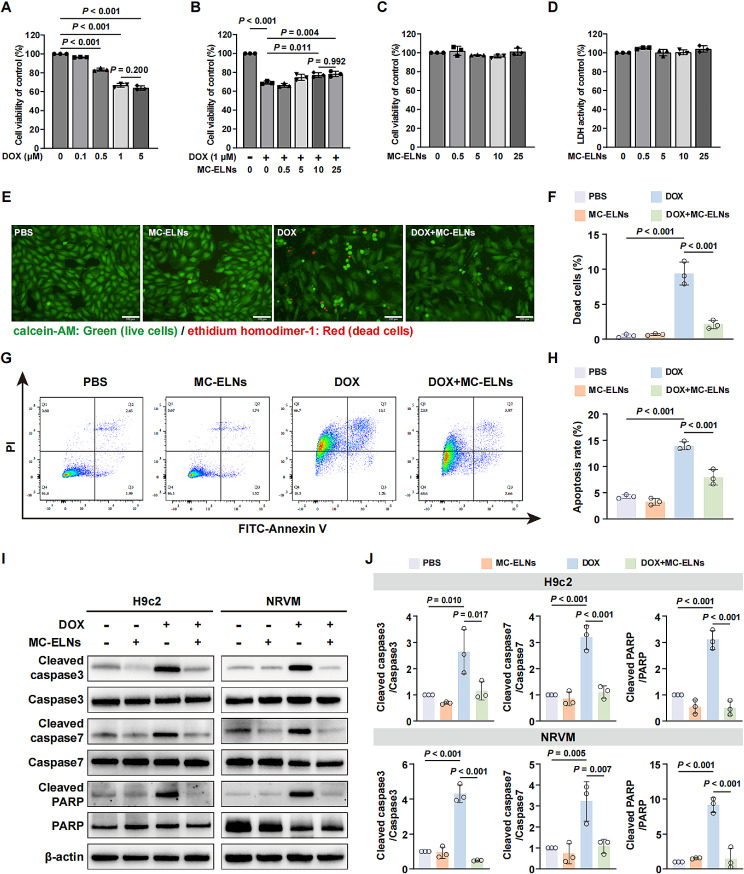
Fig. 3.
MC-ELNs suppress DOX-induced cell death in cardiomyocytes. (A) MTT assay identified the optimal concentration of doxorubicin (DOX, 1 µM) for inducing H9c2 cells death. (B) MTT assay revealed the best doses of MC-ELNs (10 µg/mL) for inhibiting DOX-induced H9c2 cells loss. MC-ELNs did not impair the cell viability (C) and generate toxicity (D) to H9c2 cells. (E) Representative calcein AM and ethidium homodimer-1 staining images for cell viability of H9c2 cells treated with 1 µM DOX in the absence or presence of 10 µg/mL MC-ELNs. The green fluorescence indicated live cells and red fluorescence indicated dead cells, respectively. Scale bar: 100 μm. (F) Histogram displays quantitative data for E. (G) Representative flow cytometry images for cell apoptosis of H9c2 cells treated with 1 µM DOX in the absence or presence of 10 µg/mL MC-ELNs. (H) Histogram displays quantitative data for G. (I, J) Western blot analysis on the protein levels of apoptosis markers in H9c2 cells or neonatal rat ventricular myocyte cells (NRVM) treated with 1 µM DOX in the absence or presence of 10 µg/mL MC-ELNs. All data are presented as mean ± SD (n = 3 experiments per group). Comparisons among more than two groups were performed by ordinary one-way analysis of variance (ANOVA) followed by the Tukey’s multiple comparisons test

