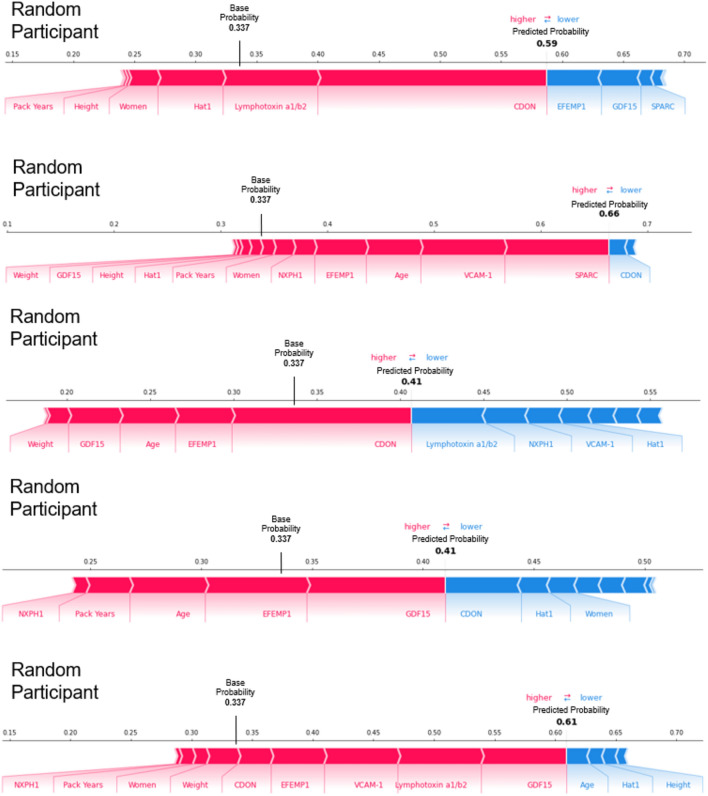
Figure 4.
Force plots for participants with a predicted probability of developing low pectoralis muscle area greater than the mean probability of the random forest combined model’s training set. Force plots for 5 randomly selected participants from the combined random forest classification model’s training set (n = 168) with a predicted probability of developing low pectoralis muscle area (PMA) greater than the mean probability of the combined model’s training set (0.337). Each predictor has a Shapley additive explanation (SHAP) value that indicates the predictors' impact on the probability of developing low PMA. Red and blue indicate whether the impact is positive or negative respectively. Five clinical measures were used: age, gender, pack years, weight, and height. Eight feature selected biomarkers for predicting the development of low PMA were used: Histone acetyltransferase type B catalytic subunit (Hat1), Secreted protein acidic and rich in cysteine (SPARC), Lymphotoxin alpha 1/ beta 2 (Lymphotoxin a1/b2), Growth/differentiation factor 15 (GDF15), Cell adhesion molecule-related/down-regulated by oncogenes (CDON), Neurexophilin-1 (NXPH1), Vascular cell adhesion protein 1 (VCAM-1), and EGF-containing fibulin-like extracellular matrix protein 1 (EFEMP1).

