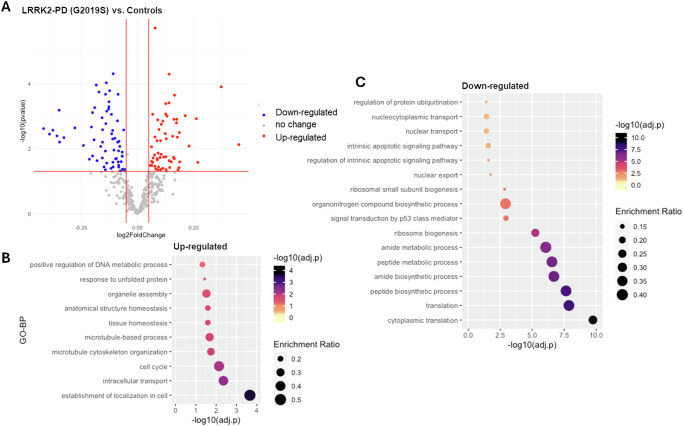
Fig. 1. DEA on whole-blood mRNA levels of LRRK2 interactors in the LRRK2-PD cases vs. Controls.
A The scatter plot shows results from DEA performed on LRRK2 interactors; LRRK2-PD (LRRK2-G2019S) cases vs. Controls. Interactors with significant alterations (|log2FC| > 0.05 & adjusted-p < 0.05) are colour coded as blue (down-regulated) and red (up-regulated) dots. B, C The bubble graphs show the enriched GO-BPs for up-regulated and down-regulated LRRK2 interactors; LRRK2-PD cases vs. Controls. The colour of the bubble represents enrichment significance (−log10(adjusted-p)), while bubble size represents enrichment ratio (intersection size/query size).

