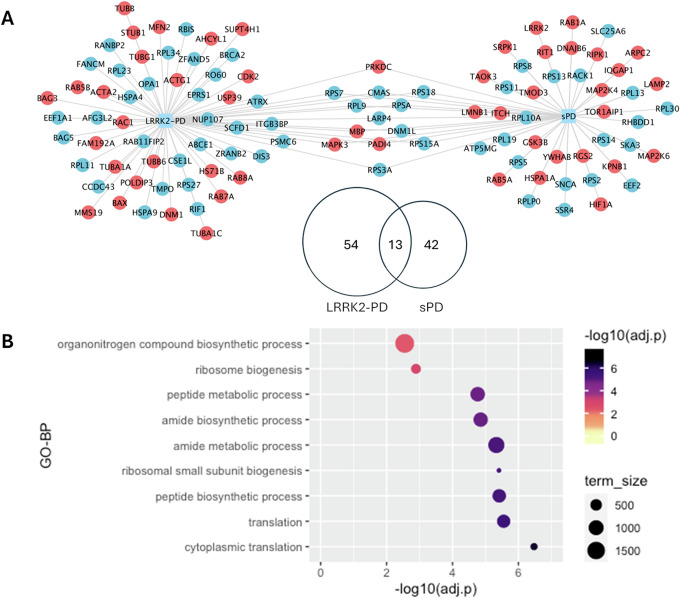
Fig. 3. DEA on LRRK2 interactors in the LRRK2-PD and sPD cases vs. Controls.
A The Venn diagram and the network graph show 13 LRRK2 interactors presenting the same differential expression pattern in the LRRK2-PD and the sPD cohorts in comparison with controls. In the network graph, interactors with significant differential expression profiles are colour-coded based on up-regulation (red) and down-regulation (blue). B The bubble graph shows the GO-BP terms enriched for the 13 LRRK2 interactors that presented similar alterations in the 2 PD conditions as compared to controls.

