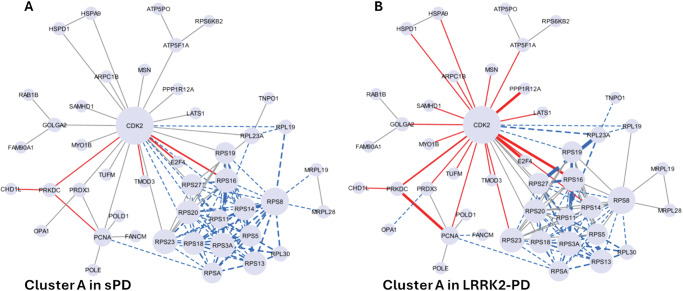
Fig. 8. Details of cluster A in LRRK2-PD and sPD.
The network graphs show the significant downregulation of Cluster A in sPD (A) and LRRK2-PD (B), in which LRRK2 interactors are represented as nodes (N = 45) while PPIs are represented as edges (N = 115). Edges are represented with a continuous red line if they are up-regulated, with a dotted blue line if they are down-regulated. The thickness of the edges refers to the level of alterations of PPIs: the line is thicker if the 2 interactors connected by a given edge exhibited both the same trend of alteration (i.e, both up-regulated or down-regulated in PD cases vs. Controls).

