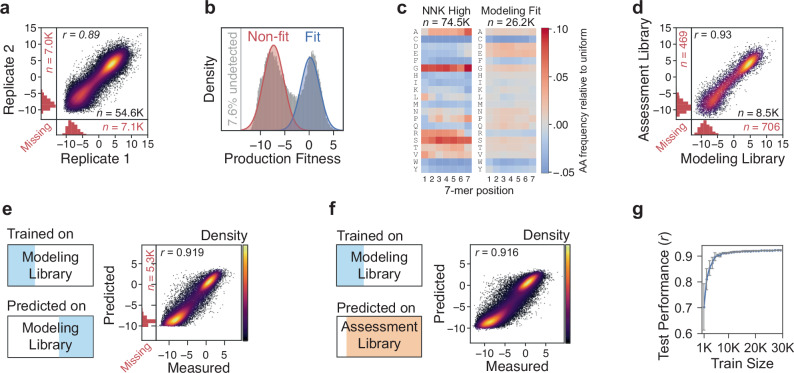
Fig. 2. Mapping and learning the 7-mer production fitness landscape.
a The correlation between the production fitness scores of codon replicate pairs is shown. The vertical and horizontal marginal histograms correspond to missing cases where only one codon replicate of a pair was detected. b The production fitness distribution of the modeling library represents the variants detected in at least one of the 24 replicates (92.4% of total variants). The distributions representing non-fit versus production-fit variants are depicted. c The amino acid distribution by position for the variants in the 74.5K most abundant sequences in an NNK library versus the production-fit distribution of the modeling library (26.2K out of 74.5K). d The production fitness replication quality is shown for the control set (10K) that is shared between the modeling and assessment libraries. The Pearson correlations between the predicted versus measured production fitness scores are shown when the model is trained on a subset of the modeling library and e tested on another subset of the same modeling library (n = 30.6K) versus when f tested on the independent assessment library, not including the overlapping 10K set (n = 57.7K after removing the undetected variants). g The performance of the production fitness prediction model is shown across different training set sizes (n = 10 models, mean ± s.d.). Source data are provided in a Source Data file.

