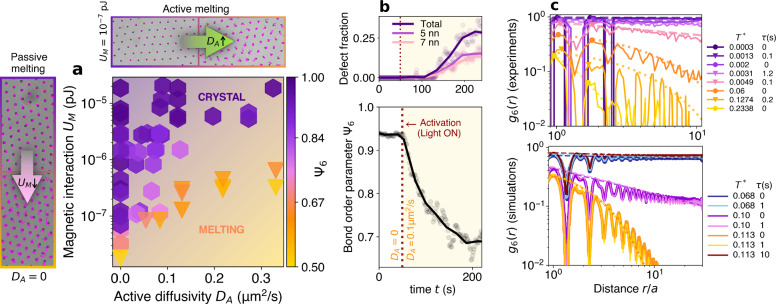
Fig. 3. Out-of-equilibrium phase diagram and active melting route.
a Phase diagram as a function on the active diffusion DA and magnetic interaction UM. Hexagonal symbols correspond to the crystalline phase, and triangles to melting systems, according to the Lindemann criterion. Each point is colored according to the structural order (average bond order parameter Ψ6). Snapshots and particle trajectories for different systems around the phase diagram, and effect of changing DA and UM: passive melting when decreasing the magnetic field without activity (Supplementary Movie 3), active melting when increasing light intensity and consequently DA at constant magnetic field and UM (Supplementary Movie 4). b Evolution of the bond order parameter Ψ6 of a crystal when light is suddenly turned on at t = 50 s so that it is activated at DA = 0.1 μm2/s. In this experiment UM = 10−7pJ and τ = 0.6 s. Top graph shows the evolution on the defect fraction in the same system, of defects consisting of particles with 5 nearest neighbors, 7 nearest neighbors, and the total. c Orientational correlation function for different global temperatures T* (Eq. (1)). with fits to power law (dashed lines) and exponential decay (dotted lines).Experimental results (top). Simulation results for groups of active and passive systems with identical total temperature (bottom).

