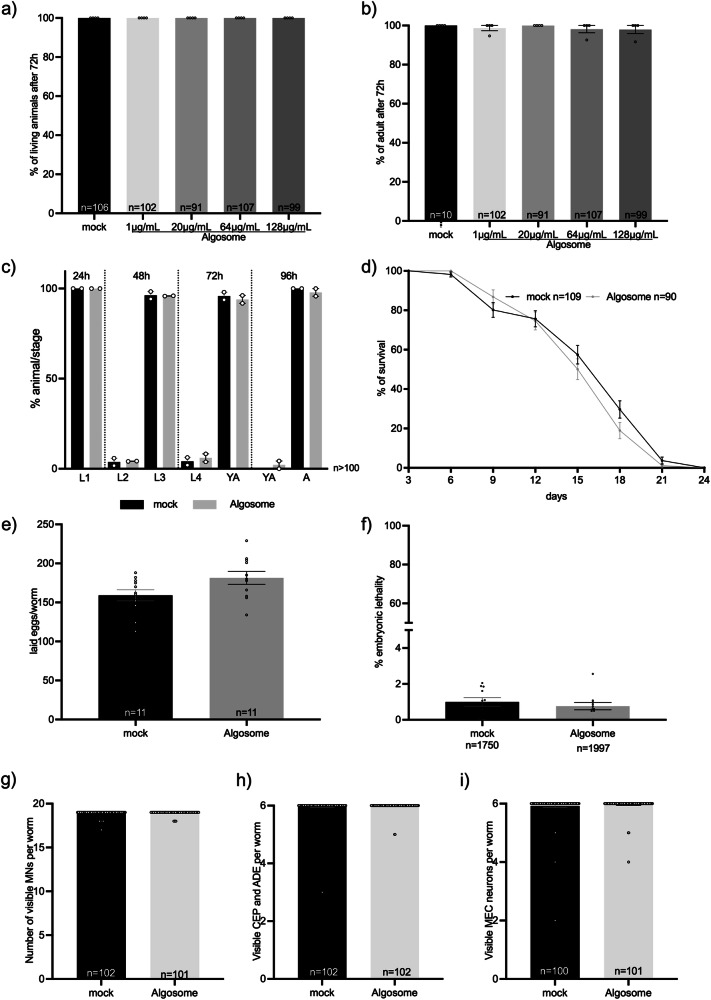
Fig. 5. Nanoalgosome in vivo biocompatibility in C. elegans.
a Quantification of the number of living animals after treatment with mock (PBS) or different nanoalgosome concentrations. b Quantification of the number of animals reaching adult stage after treatment with mock or different nanoalgosome concentrations. c Quantification of the percentages of animals at each developmental stage after treatment with mock and nanoalgosomes (20 µg/mL). d Lifespan of animals treated with mock and nanoalgosomes (20 µg/mL). e Brood size of animals after treatment with mock and nanoalgosomes (20 µg/mL). f Embryonic lethality of animals after treatment with mock and nanoalgosomes (20 µg/mL). g–i Quantification of the number of visible motoneurons (MNs), dopaminergic neurons in the head (CEP and ADE) and mechanosensory neurons (MEC) after treatment with mock and nanoalgosomes (20 µg/mL). Bars represent the means and dots the replicates (in a–d), P0 (in e, f), or single animals (in g–i); error bars are SEM. n is the number of animals analyzed (in a–d, g–i), the number of P0 animals (in e), or the number of eggs analyzed (f). In all graphs the statistical significance of the differences between treatments with mock and nanoalgosomes were assessed with Kruskal-Wallis One-way ANOVA (a, b), non-parametric Compare two proportions test (c), Mann Whitney t-test (e–i) or Log-rank (Mantel-Cox) test (d) and never found significant (p > 0.05).

