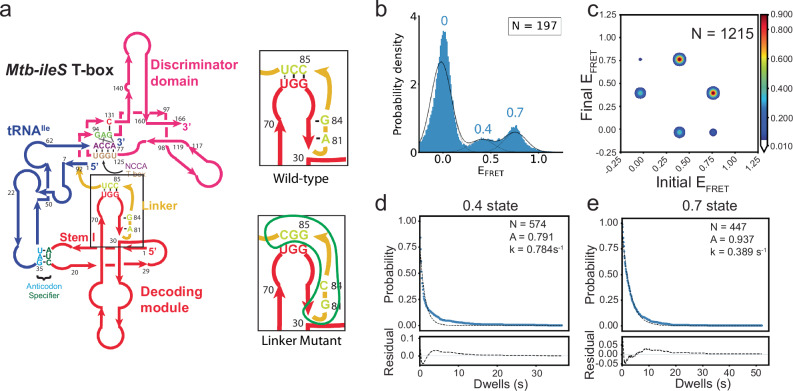
Fig. 6. Linker Mutations destabilize the Mtb-ileS T-box/tRNA complex.
a Left, schematic diagram of the Mtb-ileS T-box with the linker region shown inside the black box. Right, schematic diagrams showing the linker region (top) and the mutations introduced in the Linker Mutant (bottom). The region affected is circled in green in the mutant diagram. b FRET efficiency histogram of the data with the Linker Mutant. Fitted populations using consensus HMM modeling are plotted as in Fig. 2c. c Transition density plot constructed using the idealized Viterbi paths, as described in Fig. 2d. d, e Dwell time survival plots and fitting result using a single exponential decay function for the 0.4 FRET state (d) and 0.7 FRET state (e). Data and fitting results are presented as described in Fig. 2e. N in each plot reports the number of traces or events included in the analysis. Source data are provided as a Source Data file.

