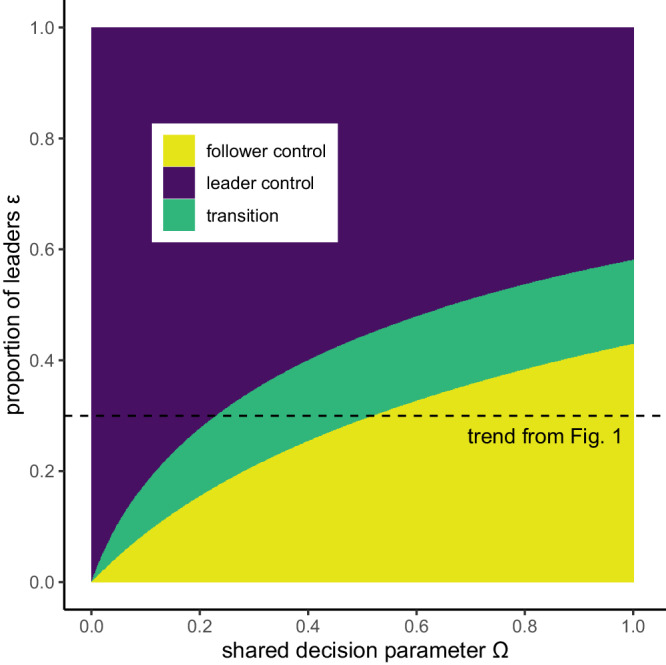
Fig. 2. Follower control of decision is only possible when they are the majority class and decisions are at least partially shared.

Population level outcome for the entire range of possible shared decision parameter values (Ω) and leader proportions (ε). Outcome given as the stable strategy under follower’s control (P = ṼF, in yellow), leader’s control (P = ṼL,, in purple), or compromise (ṼF < P < ṼL, in green). Dashed line indicates the same parameter space as displayed in Fig. 1. Parameter values C = 2 V, dc = 0.55, dv = 0.55, N = 100. Note that epsilon (ε) has been treated in the figure as a continuous variable, which is a reasonable approximation for a sufficiently large value of N.
