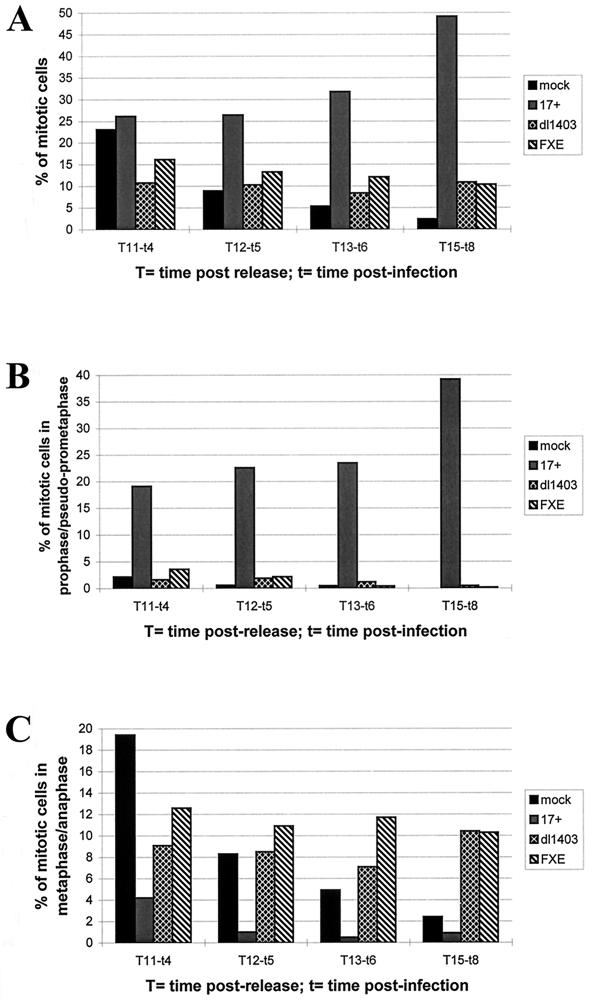
FIG. 6.
Analysis of the distribution of infected mitotic cells in different stages of mitosis. Synchronized HEp-2 cells 7 h after release from the aphidicolin block were mock infected (mock) or infected with wild-type HSV-1 (17 syn+ [17+]), Vmw110 deletion mutant dl1403, or a virus expressing the RING finger deletion mutant of Vmw110 (FXE) (MOI of 10). At various times after infection, immunofluorescence was performed with an anti-Vmw110 antibody to detect cells infected with either 17 syn+ or FXE or with an anti-Vmw175 antibody for cells infected with dl1403. DNA was stained by PI (0.5 μg/ml). Percentages of mitotic cells were determined at 4 (t4), 5 (t5), 6 (t6), and 8 (t8) h postinfection by counting three fields of cells taken randomly, using the 40× optical lens and by calculating the average results. Panels A, B, and C represent the percentages of cells being in any stages of mitosis, in prophase/pseudo-prometaphase, and in metaphase/anaphase, respectively.

