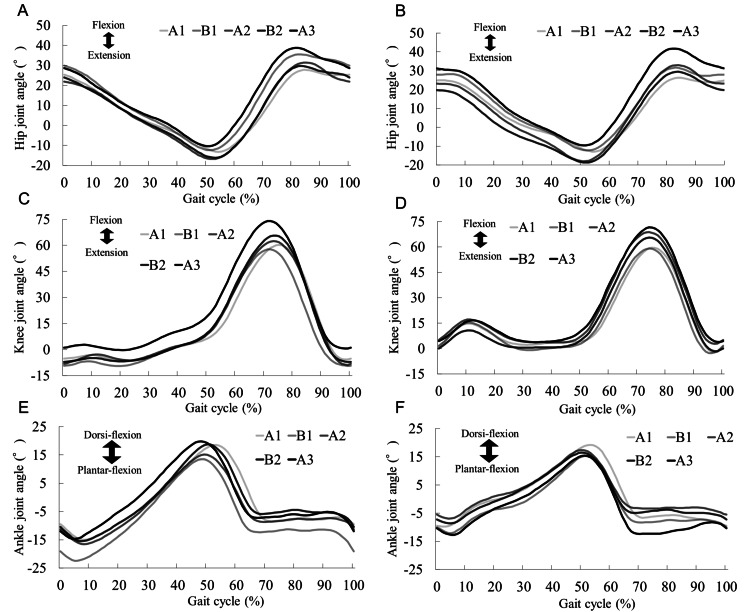
Figure 3. Average angular changes over a gait cycle in the hip, knee, and ankle joints recorded during the 10-m walking test at a comfortable walking speed.
(A) Left hip joint, (B) right hip joint, (C) left knee joint, (D) right knee joint, (E) left ankle joint, and (F) right ankle joint. The darkness of the line indicates the intervention phase progression. The hip flexion angle increased on both sides after the B1 phase.

