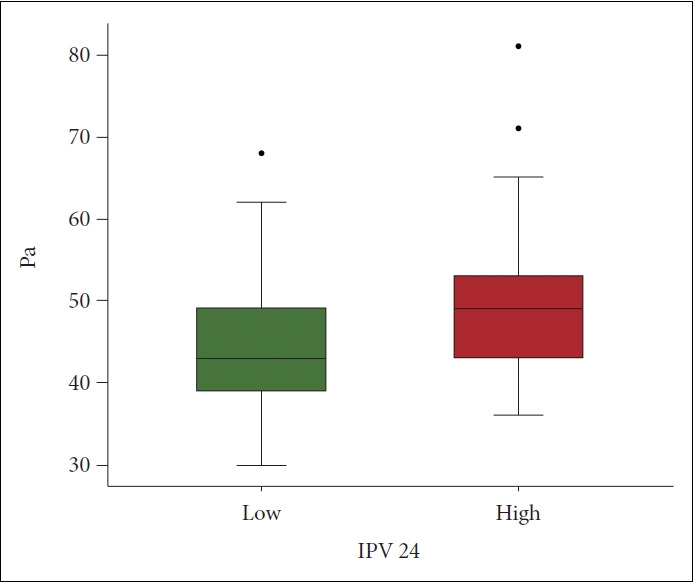
Figure 2.

Difference of Pa scale scores between low and high IPV 24 groups. The diagram shows Pa scale scores. The difference between low and high groups were examined by the independent ttest. The Pa scale scores of high (mean±SD: 49.7±8.89) compared to low group (44.6±7.06) were significantly high (t=-3.17, df=100, p<0.01). IPV 24, cutoff 24 of IPV value; Pa, paranoia; SD, standard deviation.
