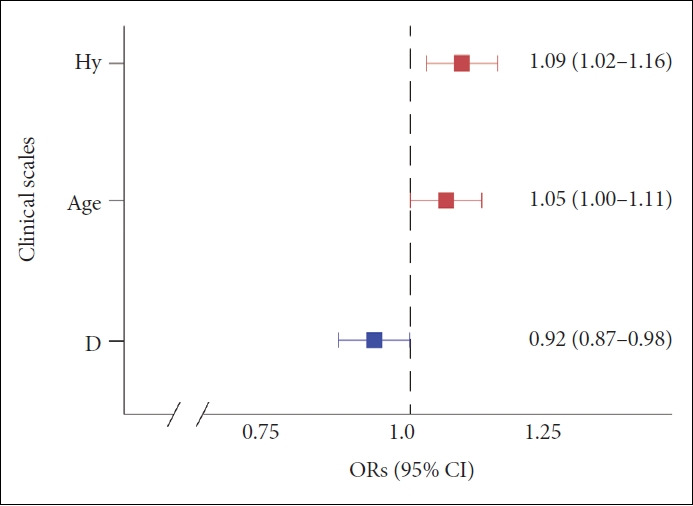
Figure 4.

Multiple logistic regression ORs plot in the IPV 30. The Hy scale scores (p<0.01), D scale scores (p<0.01), and age (p=0.04) were significantly associated with Tac IPV. OR, odds ratio; CI, confidence interval; IPV 30, cutoff 30 of IPV value; Hy, hysteria in the MMPI-2 clinical scale; D, depression; Tac IPV, tacrolimus intrapatient variability.
