
Fig. 2.
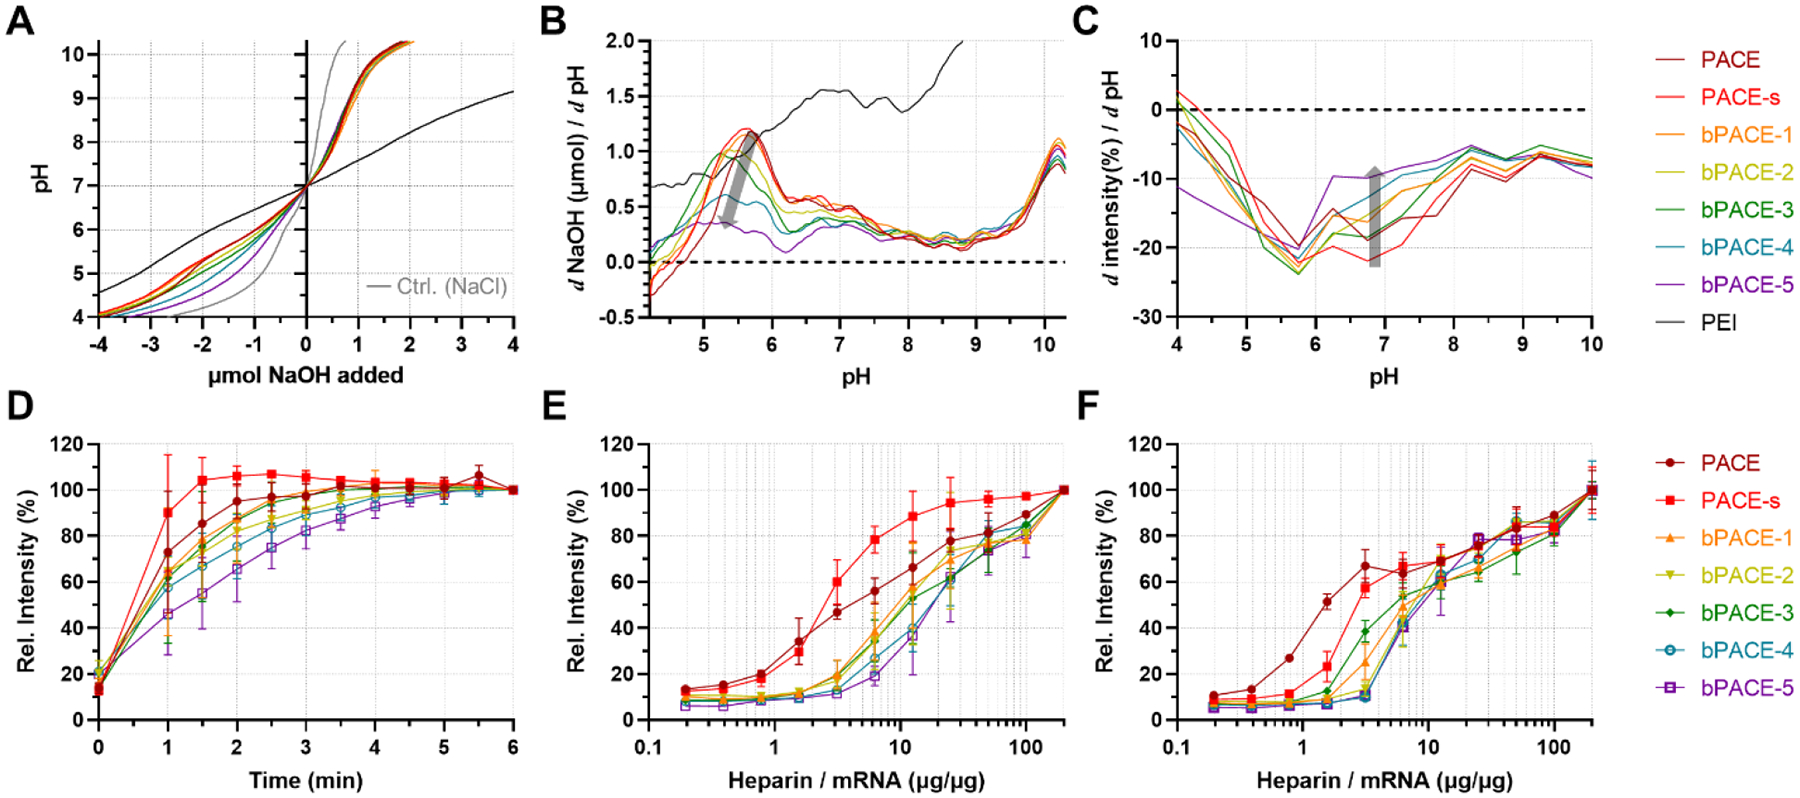
Physicochemical property of bPACE compared with PACE. (A) Acid-based titration curves of PACE, PACE-s, bPACE with various degrees of branching (bPACE-1,2,3,4,5), PEI and NaCl control (light gray). (B) Buffering curves calculated from the first derivative of acid-base titration curve. (C) Buffering curves calculated from buffering from TNS assay. (D) mRNA release quantified with Ribogreen assay after treating mRNA-bPACE polyplexes with heparin at 20:1 heparin to mRNA ratio (w/w), (E) Relative amount of released mRNA from polyplexes after 1 minute of various amounts of heparin added. (F) Relative amount of released mRNA from polyplexes after 10 minutes of various amounts of heparin added.