
Fig. 3.
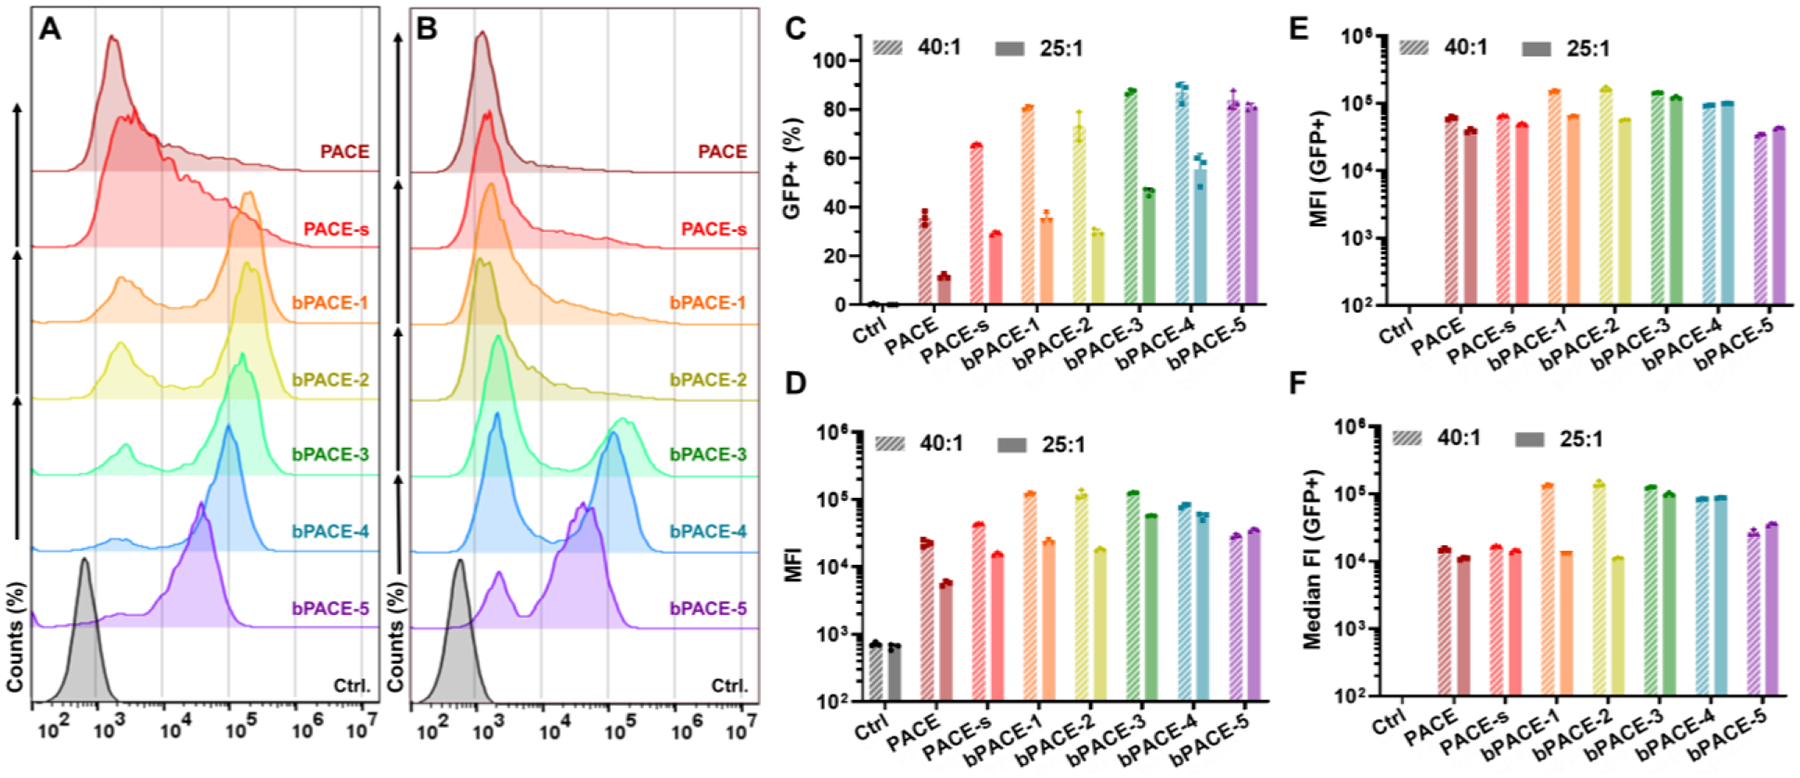
EGFP expression of A549 cells treated with EGFP-mRNA/bPACE polyplexes formulated with 40:1 and 25:1 of polymer:mRNA ratio, using flow cytometry. (A) Histogram of fluorescence intensity (EGFP) of A549 cells treated with 40:1 polymer/mRNA ratio. (B) Histogram of fluorescence intensity (EGFP) of A549 cells treated with 25:1 ratio. (C) Percentage of EGFP-expressing cells. (D) Mean fluorescence intensities (MFI) of EGFP from the total live cells. (E) MFI and (F) median fluorescence intensity of EFGP obtained from GFP-positive populations. (n=3, mean ± S.D.)