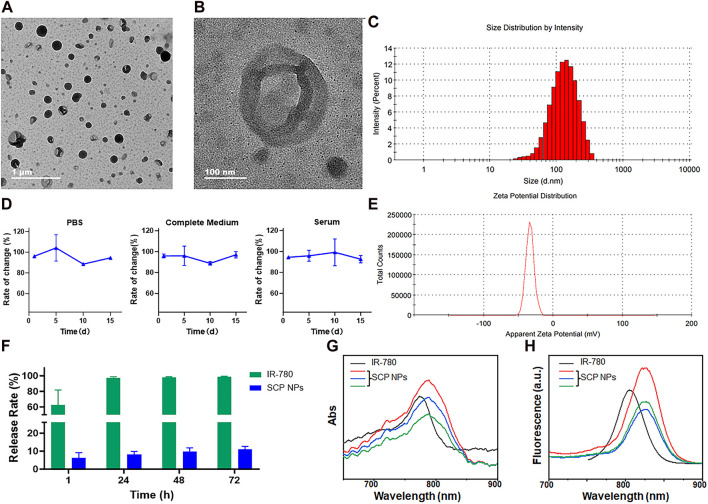
FIGURE 1.
The characterization results of SCP NPs. (A) Full-field TEM image of SCP NPs; (B) Detailed TEM image of SCP NPs; (C) Size distribution of SCP NPs; (D) Size change curve of SCP NPs in PBS, complete culture medium, and serum (n = 3); (E) Zeta potential test results of SCP NPs; (F) The IR-780 release test results of SCN NPs (n = 3); (G) The comparison between the absorption spectrum of SCP NPs and IR-780; (H) The comparison between the fluorescence spectrum of SCP NPs and IR-780.

