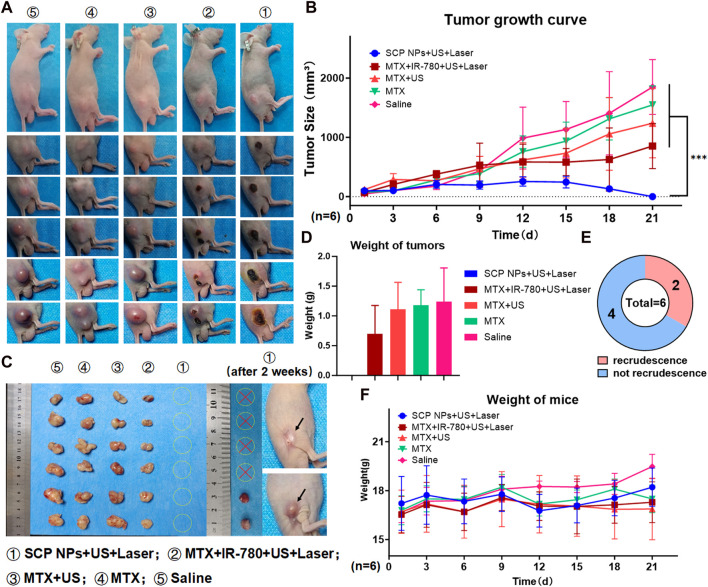
FIGURE 10.
In vivo anti-tumor test of SCP NPs. (A) The photos of mice’s tumor areas in each group during the test; (B) The average tumor volume growth curve of mice in each group during the intervention; (C) The visible residual tumor in each group of mice after the intervention, and the tumor recurrence of SCP NPs combined treatment mice 2 weeks after the intervention. The arrows point to the recrudescent tumor and recovery area; (D) The analysis results of the visible residual tumors’ average weight in each group of mice after the intervention; (E) The statistics of tumor recurrence for mice in the SCP NPs combined treatment group 2 weeks after the intervention; (F) The average weight change curve of mice in each group during the intervention process.

