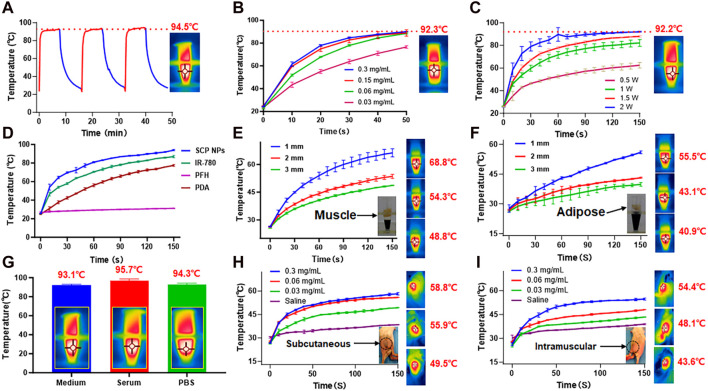
FIGURE 2.
Photothermal conversion test results of SCP NPs. (A) Thermal stability and maximum temperature rise test results of SCP NPs, 808 nm, 2 W/cm2; (B) The temperature rise curves of SCP NPs with different concentrations under the same power laser irradiation; (C) The temperature rise curves of SCP NPs under different power laser irradiation; (D) The photothermal heating curve of SCP NPs and its main components; (E, F) The photothermal heating curve of SCP NPs under the blocking of muscle and fat tissue with different thicknesses, 808 nm, 1 W/cm2; (G) The maximum temperature rising test of SCP NPs in PBS, Serum, and Medium, respectively; (H,I) The photothermal heating curves of SCP NPs in the subcutaneous and intramuscular area of mice, 808 nm, 1 W/cm2. All tests were n = 3.

