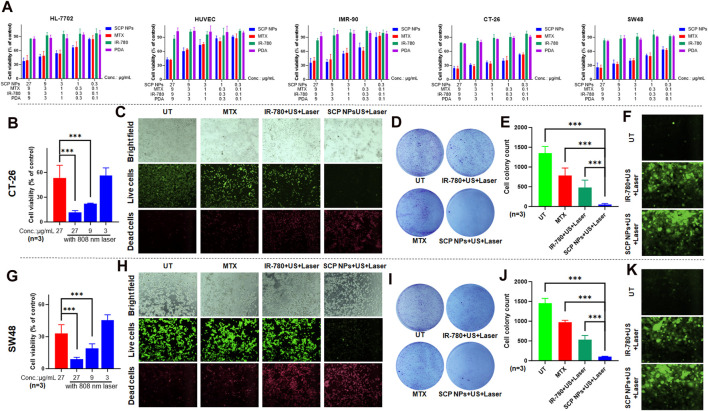
FIGURE 4.
Synergistic therapeutic effect of SCP NPs at the cellular level. (A) Cytotoxicity test results of SCP NPs, the cell lines were HL-7702, HUVEC, IMR-90, CT-26, and SW48; (B) Cell survival rate of CT-26 cell line under photothermal treatments (n = 3); (C) The fluorescence microscope images of CT-26 cells with live and dead cell staining after the treatment of SCP NPs combined intervention; (D, E) The colony formation results of CT-26 cells after the treatment of SCP NPs combined with different interventions (n = 3); (F) The fluorescence microscope images of CT-26 cells’ intracellular ROS production with different interventions; (G) The cell survival rate of SW48 cells after the SCP NPs and photothermal treatments (n = 3); (H) The fluorescence microscope images of SW48 cell with live and dead cell staining after the treatment of SCP NPs combined with intervention; (I, J) The colony formation results of SW48 cells after the treatment of SCP NPs combined with different interventions (n = 3); (K) The fluorescence microscope images of SW48 cells’ intracellular ROS production with different interventions. In terms of statistically significant differences, p < 0.001 is marked as ***.

